Skip all navigation and jump to content Jump to site navigation Jump to section navigation.
NASA Logo - Goddard Space Flight Center + Visit NASA.gov
HOME PROJECTS RESOURCES SEARCH MAP

+ Advanced Search
Home
Home
View Most Recently Released Imagery
View Gallery of Imagery: A topical collection of SVS Imagery
Search Imagery by the keywords assigned to it
Search Imagery by the instruments that supplied data for a visualization product
Search Imagery by the series of visualizations that have been produced
Search Imagery by the scientist providing the data used in a visualization product
Search Imagery by the animator that created the product
Search Imagery by the identification number assigned to the visualization product
See other search options
Learn about the SVS Image Server
  + About the Server
  + Animation List
  + How to Use the Server


  + RSS Feeds
blank image
Previous Animation
Next Animation
Anatomy of Hurricane Isabel

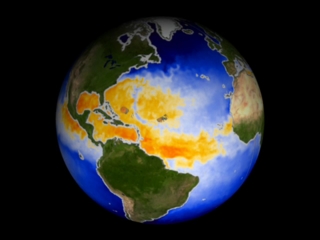
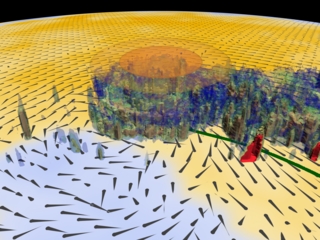
This visualization shows several data sets from Hurricane Isabel. Sea surface temperature (SST) as seen by Aqua/AMSR-E is represented by the colors in the ocean. Red and yellow are waters above 82 degrees Fahrenheit which is favorable for hurricane formation. Sea surface winds as seen by QuikSCAT are represented by the arrows over the SSTs. Internal rain structure as seen by TRMM/PR is represented by the semi-transparent surfaces close to the ocean surface. Isabel's wam hurricane core as seen by GOES/AMSU is represented by the ellipsoid shapes above the rain structure. This visualizaiton was intended as a proof of concept; but has been released due to it's popularity.

Anatomy of Hurricane Isabel    Anatomy of Hurricane Isabel
Duration: 39.0 seconds
Available formats:
  1280x720 (29.97 fps) MPEG-2   85 MB
  320x240 (30 fps) MPEG-1   4 MB
  640x480 (30 fps) MPEG-1   17 MB
  720x480 (29.97 fps) MPEG-2   28 MB
  1280x720 (30 fps) Frames
  720x486 (30 fps) Frames
  320x240     JPEG         32 KB
How to play our movies


Anatomy of Hurricane Isabel when it was far out in the Atlantic    Anatomy of Hurricane Isabel when it was far out in the Atlantic

Available formats:
  2560 x 1920     TIFF 5 MB
  320 x 240         JPEG 73 KB
  160 x 80           PNG 26 KB
  80 x 40             PNG   6 KB

Animation Number:3252
Animators:Greg Shirah (SVS) (Lead)
 Lori Perkins (SVS)
Completed:2005-09-14
Scientist:Jeff Halverson (JCET UMBC)
Instruments:Aqua/AMSR-E
 QuikSCAT/SeaWinds
 TRMM/PR
 GOES/AMSU
Data set:Blue Marble
Data Collected:TRMM/PR: 2003/09/10 and 2003/09/15; AMSU: 2003/09/10 at 10:12Zand 2003/09/14 at 23:09Z; SST: 2003/09/06,07,08,10,12,14,15; QuikSCAT: 2003/09/10 at 20:57Z, 2003/09/14 at 22:35Z
Series:Hurricane Isabel
Keywords:
SVS >> HDTV
SVS >> Sea Surface Temperature
SVS >> Sea Surface Wind
GCMD >> EARTH SCIENCE >> Atmosphere >> Atmospheric Phenomena >> Hurricanes
GCMD >> EARTH SCIENCE >> Atmosphere >> Atmospheric Temperature >> Temperature Profiles
GCMD >> EARTH SCIENCE >> Atmosphere >> Atmospheric Winds >> Wind Stress
GCMD >> EARTH SCIENCE >> Oceans >> Ocean Temperature >> Sea Surface Temperature
 
 
Please give credit for this item to
NASA/Goddard Space Flight Center Scientific Visualization Studio


Back to Top

USA.gov logo - the U.S. Government's official Web portal. + Privacy Policy and Important Notices
+ Reproduction Guidelines
NASA NASA Official:
SVS Contact:
Curator: