Sea Surface Temperature, 2005 (WMS)
|
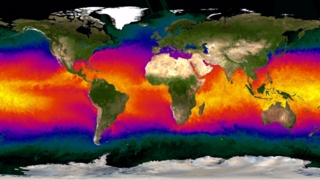
The temperature of the surface of the world's oceans provides a clear indication of the state of the Earth's climate and weather. In this visualization sequence covering the period from January to June, 2005, the most obvious effects are the north-south movement of warm regions across the equator due to the seasonal movement of the sun and the seasonal advance and retreat of the sea ice near the North and South poles. It is also possible to see the Gulf Stream, the warm river of water that parallels the east coast of the United States before heading towards northern Europe, in this data.
|
|
|
|
This animation shows the sea surface temperature for the first part of 2005.
Duration: 8.0 seconds
Available formats:
1024x512
Frames
2048x1024
Frames
1280x720 (29.97 fps)
MPEG-2
17 MB
320x240 (30 fps)
MPEG-1
1 MB
720x480 (29.97 fps)
MPEG-2
6 MB
80x40
PNG
8 KB
320x180
JPEG
52 KB
160x80
PNG
34 KB
How to play our movies
|
|
This product is available through our Web Map Service.
Click here to learn more.
|
|
|
|
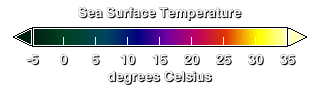
This is the color bar for sea surface temperature. Values are given in degrees Celsius.
Available formats:
320 x 90
PNG
1 KB
|
|
|
Back to Top
|

