Ayles Ice Shelf Breakup in Arctic
|
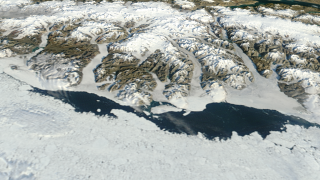
On August 13, 2005, almost the entire Ayles Ice Shelf calved from the northern edge of Ellesmere Island. This reduced the remaining ice shelves there from 6 to 5, and continues a trend of dramatic loss of these ice shelves over the past century. Since 1900, approximately 90% of the Ellesmere Island ice shelves have calved and floated away. This is a one-way process as there is insufficient new ice formation to replace the ice that has been lost. The Ayles calving event was the largest in at least the last 25 years; a total of 87.1 sq km (33.6 sq miles) of ice was lost in this event, of which the largest piece was 66.4 sq km (25.6 sq. miles) in area. This piece is equivalent in size to approximately 11,000 football fields or a little larger than the island of Manhattan.
|
|

|
|
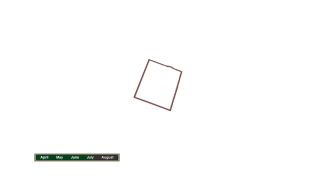
This animation starts from a global view and zooms into the Ayles Ice Shelf. The region is identified by a red outline. The shelf itself is identified by two flashes of solid red before the ice shelf breakup is shown. A date/time bar shows the progression of time.
Duration: 40.0 seconds
Available formats:
1280x720 (29.97 fps)
Frames (Composite)
320x180
PNG
116 KB
160x80
PNG
27 KB
80x40
PNG
7 KB
1280x720 (30 fps)
MPEG-2
49 MB
512x288 (30 fps)
MPEG-1
4 MB
1280x720 (29.97 fps)
MPEG-4
5 MB
How to play our movies
|
|
|
|
This animation displays only the imagery without the overlay layer described below.
Duration: 40.0 seconds
Available formats:
1280x720 (29.97 fps)
Frames (Background)
320x180
PNG
116 KB
1280x720 (30 fps)
MPEG-2
48 MB
512x288 (30 fps)
MPEG-1
4 MB
1280x720 (29.97 fps)
MPEG-4
5 MB
How to play our movies
|
|
|
|
This overlay has the animated date/time bar along with the box outline that identifies the region of the Ayles Ice Shelf. In addition, the overlay identifies the shelf itself by flashing the region of change twice in frames 400 through 550.
Available formats:
1280x720 (29.97 fps)
Frames (Overlay)
320x180
PNG
7 KB
How to play our movies
|
|
|
Back to Top
|

