|
|
 |
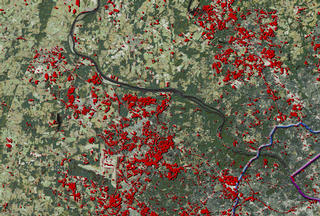
Urban Growth: Reston and Sterling, VA
|
|

|
|
Starting with a view of the Washington, D.C., metropolitan area, the D.C. border and the Beltway fade in. The view then shifts to Reston and Sterling, Virginia, indicating urban growth with red dots. Data sets for 1973, 1980, 1985, 1990, and 1996 are presented chronologically.
Duration: 24.0 seconds
Available formats:
352x240 (29.97 fps)
MPEG-1
3 MB
160x80
PNG
26 KB
80x40
PNG
7 KB
320x242
JPEG
19 KB
How to play our movies
|
|
|
|
Using Landsat data to study Urban Sprawl. In this image the red dots indicate areas of urban growth.
Available formats:
2880 x 1944
TIFF
16 MB
160 x 80
PNG
31 KB
320 x 216
JPEG
35 KB
80 x 40
PNG
7 KB
|
| Animation Number: | 1037 |
| Animator: | Stuart A. Snodgrass (Lead) |
| Studio: | NASA |
| Completed: | 2000-02-21 |
| Scientist: | Jeffrey Masek (University of Maryland) |
| Instrument: | Landsat |
| Data Collected: | 1998/03/27 |
| Series: | AAAS |
| Video: | SVS2000-0002 * |
Keywords:
DLESE
>> Human geography
SVS
>> Sprawl
SVS
>> Urban
SVS
>> Washington DC
|
More Information on this topic available at:
stories/AAAS/index.html
|
|
Please give credit for this item to
NASA/Goddard Space Flight Center
Scientific Visualization Studio |
*Please note: the SVS does not fulfill requests for copies of the tapes in our library. On some of our animation pages, there is a direct link to a video distribution service from which tapes, handled by the Public Affairs Office (PAO)/Goddard TV, including some of our animations may be ordered. General information on this service can be found here. |
|
Back to Top
|
|
|
|

