Tropical Analysis and Forecast Branch (TAFB) products include: marine High Seas Forecasts over the tropics and subtropics, Offshore Waters Forecasts over the tropics and subtropics, Tropical Weather Discussions over the tropics and subtropics, and surface weather analyses and forecasts over the tropics, subtropics, and mid-latitudes.Many TAFB products are available over high seas radiofax on upper side-band (USB). The TAFB radiofax product transmission schedule and frequency list is transmitted daily at 0630 and 1830 UTC. Transmission is from the United States Coast Guard located at New Orleans, LA.
Marine Forecasts
High Seas Forecasts
Nowcasts through 36-hour forecasts of winds, waves, and convection updated every six hours, including any marine warnings for gale, storm, and tropical cyclone conditions. Can also include information on reduced visibility and other marine hazards.
Areas of responsibility: The Atlantic Ocean from 7°N to 31°N west of 35°W, including the Caribbean Sea and Gulf of Mexico; the Northeast Pacific Ocean from the Equator to 30°N east of 140°W; and the Southeast Pacific Ocean from the Equator to 18.5°S east of 120°W.
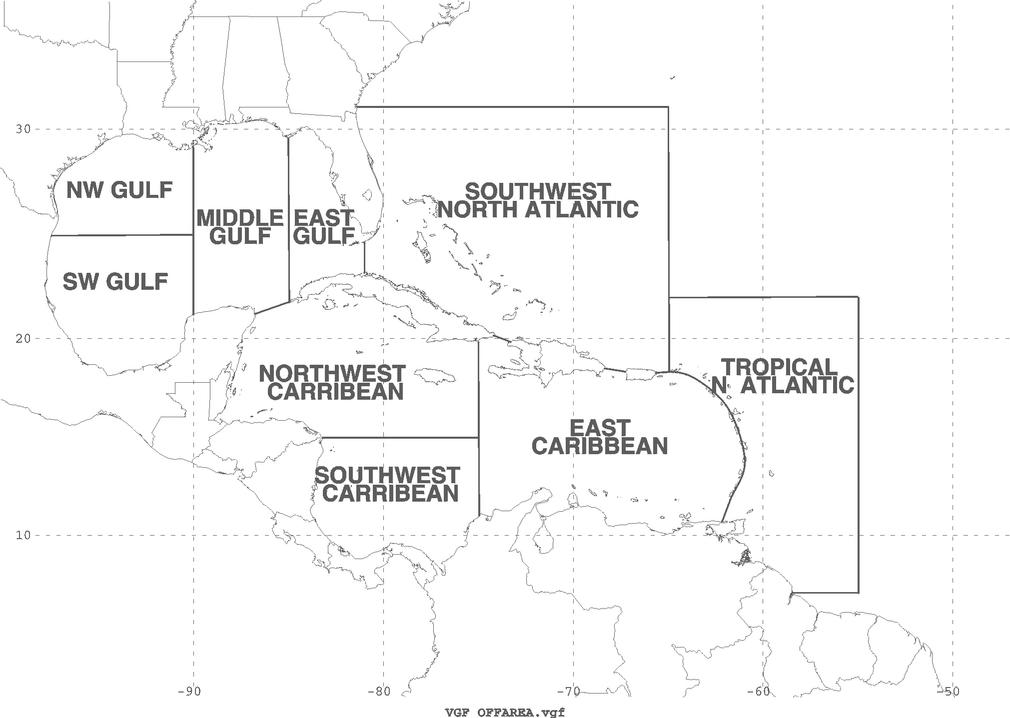
Offshore Waters Forecasts
Nowcasts through 5-day forecasts of winds, waves, and convection (only nowcasts) updated every six hours. These include marine warnings for gale, storm, and tropical cyclone conditions. Can also include information on reduced visibility and other marine hazards.
Areas of responsibility: The Atlantic Ocean south of 31°N west of 65°W and from 7°N to 22°N between 55°W and 65°W; the entire Caribbean Sea and the Gulf of Mexico beyond the Coastal Waters Forecast.
Graphic Products Legend
Here is an explanation of the symbols used in the various graphic forecast and analysis products that follow (black & white version).
Wind/Wave Forecasts
Atlantic, Caribbean, and Gulf of Mexico
24-hour, 48-hour, and 72-hour wind-wave forecast for the western Atlantic, Caribbean, and Gulf of Mexico. Wind values are in knots and significant wave heights are in feet. Significant wave height is defined for the combined seas (the square root of the sum of the wind wave height squared plus the primary swell height squared). The forecasts are presented as full-color and black & white gifs.
Forecast Issue Time UTC (B&W=black&white version)
24-hour 0000 B&W 0600 B&W 1200 B&W 1800 B&W
48-hour 0000 B&W 1200 B&W
72-hour 0000 B&W 1200 B&W
Eastern Pacific
Nowcast, 24-hour, 48-hour, and 72-hour wind-wave forecast for the eastern Pacific Ocean. Wind values are in knots and combined wind/sea wave heights are in feet. The forecasts are presented as full-color and black & white gifs.
Forecast Issue Time UTC (B&W=black&white version)
00-24 hour (2-panel) 0000 B&W 0600 B&W 1200 B&W 1800 B&W
48-hour 0000 B&W
48-72 hour (2-panel) 1200 B&W
Note: TIFF versions of most of these products may be obtained from NWS Weather Charts
Surface Forecasts
Atlantic, Caribbean, and Gulf of Mexico
24-hour, 48-hour, and 72-hour surface forecasts for the Atlantic, Caribbean, and the Gulf of Mexico. Isobars are drawn at 4 mb intervals and supplemented with 2 mb spacing as necessary.
Forecast Issue Time UTC (B&W=black&white version)
24-hour 0000 B&W 1200 B&W
48-hour 0000 B&W 1200 B&W
72-hour 0000 B&W 1200 B&WEastern Pacific
24-hour, 48-hour, and 72-hour surface forecasts for the Eastern Pacific Ocean. Isobars are drawn at 4 mb intervals and supplemented with 2 mb spacing as necessary.
Forecast Issue Time UTC (B&W=black&white version)
24-hour 0000 B&W 1200 B&W
48-hour 0000 B&W 1200 B&W
72-hour 0000 B&W 1200 B&W
Atlantic Sea State Analysis
Analysis of significant sea state at 3-foot height contour intervals. The red arrows point along the primary swell direction (yellow arrows are actual ship observations of swell direction). Analyses are presented as full-color and black & white gifs.
Issue Time UTC (B&W=black&white version)
0000 B&W 0600 B&W 1200 B&W 1800 B&W
Peak Wave Period / Primary Swell Direction
48-hour and 72-hour analysis of the period of the primary wave contoured every 2 seconds, identifying either the locally generated wind/sea (in cases with strong local winds) or the dominant wave system (swell) that is generated elsewhere. The arrows point along the primary swell direction. The charts are manually edited but are based on guidance from the WaveWATCH III model. Analyses are presented as full-color and black & white gifs.
Atlantic, Caribbean, and Gulf of Mexico
Forecast Issue Time UTC (B&W=black&white version)
48-hour 0000 B&W 1200 B&W
72-hour 0000 B&W
Eastern Pacific
Forecast Issue Time UTC (B&W=black&white version)
48-hour 1200 B&W
48-72 hour (2-panel) 0000 B&W
Tropical Cyclone Danger Areas
Note: The Tropical Cyclone Danger Areas graphic is only issued during the hurricane season (1 June - 30 November for the Atlantic, 15 May - 30 November for the Eastern Pacific)
Current tropical cyclone forecast track and danger area for each system is depicted as the shaded region in the graphic. Danger area is determined by adding 100-200-300 nautical miles to the 24-48-72 hour forecast position and maximum 34 knot wind radii respectively. The values used in determining danger areas are based on the latest 10-year average error in forecast tracks issued by the NHC. The TPC does not warrant that avoiding these danger areas will eliminate the risk of harm from tropical cyclones. Users operating in the vicinity of these systems are advised to continually monitor the latest Forecast/Advisories from the NHC and proceed at their own risk. The danger area will not be depicted from tropical cyclones that transition to extratropical status.
Atlantic, Caribbean, and Gulf of Mexico
Eastern Pacific
High Wind/Wave Graphic
Note: The High Wind/Wave Graphic is only issued outside of the hurricane season (1 December - 31 May for the Atlantic, 1 December - 14 May for the Eastern Pacific)
The High Wind/Wave Graphic coverage area for the Atlantic is from 5°N to 40°N between 35°W and 100°W and the area for the Pacific is from the equator to 40°N between 75°W and 150°W. Current conditions are depicted with information taken from the latest High Seas Forecasts (HSF).
For both basins the wind threshold is sustained wind 25 knots or higher south of 31°N (30°N for the Pacific) and gale conditions and higher north of 31°N (30°N for the Pacific). Wave heights depicted correspond to the wind conditions.
The Marine Prediction Center may occasionally describe wind and wave conditions in the Gulf Stream. When this occurs the north wall of the Gulf Stream (as given in the High Seas Forecast) is depicted as a thick solid line with the associated wind and wave conditions given.
Atlantic, Caribbean, and Gulf of Mexico
Forecast Issue Time UTC (B&W=black&white version)
0000 B&W 0600 B&W 1200 B&W 1800 B&W
Eastern Pacific
Forecast Issue Time UTC (B&W=black&white version)
0000 B&W 0600 B&W 1200 B&W 1800 B&W
Satellite Products and Discussions
Tropical Weather Discussions
The Atlantic Tropical Weather Discussion (TWD) is a narrative of significant surface or upper level weather features including fronts, troughs, cyclones, and anticyclones, and special feature discussions for systems such as tropical cyclones or tropical disturbances. It also includes satellite-based descriptions of significant weather. TAFB issues TWDs every six hours for the Atlantic from the Equator to 32°N between Africa and roughly 100°W, including the Caribbean and Gulf of Mexico.
The Pacific TWD is similar but less detailed. It concentrates on surface weather systems and satellite-based descriptions of significant weather. TAFB issues Tropical Weather Discussions every six hours for the northeastern Pacific from the Equator to 32°N east of 140°W.
The Marine Weather Discussion is similar to the Atlantic TWD except that it concentrates on the Gulf of Mexico, Caribbean Sea, and the Southwest North Atlantic South of 31°N and west of 55°W.
Pan-American Temperature and Precipitation Table
A table summarizing the weather, temperatures, and rainfall for the Caribbean and Central American countries, issued twice daily from 0000 UTC and 1200 UTC data.
Satellite Rainfall Estimates
Satellite rainfall estimates for tropical cyclones or other significant convective systems are produced when these systems threaten land. These estimates employ infrared satellite imagery and satellite observed motion estimates. Results are given in ranges of potential rainfall in 1-degree-wide semicircles to the left and right of the observed system motion.
TAFB issues estimates when tropical cyclones or convective systems threaten the Caribbean region or the southeastern United States. They are also issued when eastern Pacific tropical cyclones threaten the west coast of Mexico.
5-day Satellite Hovmöller diagrams
These are (rather large) experimental products and updates may be infrequent.
- Tropical Atlantic and Caribbean (GOES-EAST)
- Gulf of Mexico and subtropical Atlantic (GOES-EAST)
- Eastern Atlantic and Africa (METEOSAT-7)
- Southern CONUS and subtropical Atlantic (GOES-EAST)
- Tropical Eastern Pacific (GOES-WEST)
Gulf of Mexico
A subsection of the Tropical Surface Analysis covering the region from 15°N to 35°N, 75°W to 105°W. Issued four times a day at 0000, 0600, 1200, and 1800 UTC.
Issue Time UTC
Eastern North Pacific Tropical Surface Analysis
A subsection of the Tropical Surface Analysis covering the region from 5°S to 35°N, 75°W to 125°W. Issued four times a day at 0000, 0600, 1200, and 1800 UTC.
Issue Time UTC
Streamline Analysis
Note: These products are presented in TIFF format from the weather.noaa.gov servers. If you are having difficulty viewing the TIFF images, then please read this.
850 mb Streamline Analysis (Updated twice daily)
200 mb Streamline Analysis (Updated twice daily)
Sea Surface Temperature Analyses
A monthly one-degree global SST climatology produced once a week from monthly optimum interpolation (OI) SST analyses with an adjusted base period of 1950-79. The coverage is roughly between 40°S and 60°N globally. The analyses are based on ship and buoy SST data supplemented by satellite SST retrievals. In addition, SST climatology is derived from monthly analyses using sea-ice coverage data over a 12-year period (1982-93). The one-degree climatology resolves equatorial upwelling and fronts. More information is available here.