Hurricane Ivan Rainfall Structure seen by TRMM on September 16, 2004
|
|
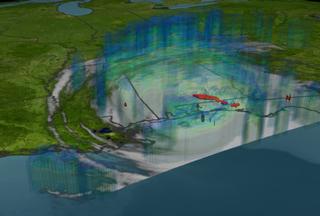
NASA's TRMM spacecraft is used by meteorologists to understand Hurricane Ivan. TRMM snapped this view of Hurricane Ivan on September 15, 2004, just before the storm strikes land. The cloud cover is taken by TRMM's Visible and Infrared Scanner (VIRS). The rain structure is taken by TRMM's Tropical Microwave Imager (TMI). It looks underneath of the storm's clouds to reveal the underlying rain structure. Blue represents areas with at least 0.25 inches of rain per hour. Green shows at least 0.5 inches of rain per hour. Yellow is at least 1.0 inches of rain and red is at least 2.0 inches of rain per hour.
|
|

|
|
TRMM provides this view of Hurricane Ivan on September 16, 2004, as its eye makes landfall. TRMM lets us see through the clouds. Blue represents areas with at least 0.25 inches of rain per hour. Green shows at least 0.5 inches of rain per hour. Yellow is at least 1.0 inches of rain and red is at least 2.0 inches of rain per hour.
Duration: 13.0 seconds
Available formats:
720x486 (29.97 fps)
Frames
640x480 (30 fps)
MPEG-1
7 MB
320x240 (30 fps)
MPEG-1
1 MB
320x240
JPEG
14 KB
320x240
JPEG
14 KB
1280x720 (29.97 fps)
Frames
How to play our movies
|
|
|
|
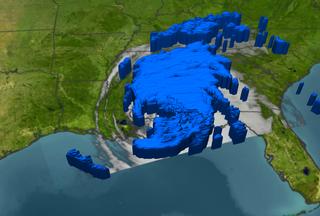
TRMM provides this view of Hurricane Ivan on September 16, 2004, as its eye makes landfall. TRMM lets us see through the clouds. Blue represents areas with at least 0.25 inches of rain per hour.
Available formats:
720 x 486
TIFF
549 KB
160 x 80
PNG
24 KB
320 x 216
JPEG
12 KB
80 x 40
PNG
6 KB
|
|

|
|
TRMM provides this view of Hurricane Ivan on September 16, 2004, as its eye makes landfall. TRMM lets us see through the clouds. Blue represents areas with at least 0.25 inches of rain per hour. Green shows at least 0.5 inches of rain per hour.
Available formats:
720 x 486
TIFF
506 KB
320 x 216
JPEG
11 KB
|
|

|
|
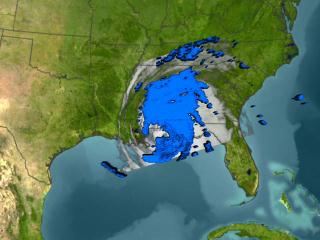
TRMM provides this view of Hurricane Ivan on September 16, 2004, as its eye makes landfall. TRMM lets us see through the clouds. Blue represents areas with at least 0.25 inches of rain per hour. Green shows at least 0.5 inches of rain per hour. Yellow is at least 1.0 inches of rain.
Available formats:
720 x 486
TIFF
557 KB
320 x 216
JPEG
11 KB
|
|
|
|
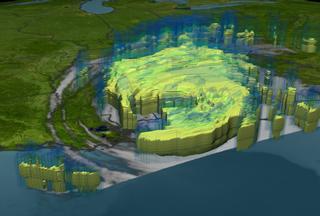
TRMM provides this view of Hurricane Ivan on September 16, 2004, as its eye makes landfall. TRMM lets us see through the clouds. Blue represents areas with at least 0.25 inches of rain per hour. Green shows at least 0.5 inches of rain per hour. Yellow is at least 1.0 inches of rain and Red is at least 2.0 inches of rain per hour.
Available formats:
720 x 486
TIFF
526 KB
320 x 216
JPEG
9 KB
|
|
|
Back to Top
|

