Skip all navigation and jump to content Jump to site navigation Jump to section navigation.
NASA Logo - Goddard Space Flight Center + Visit NASA.gov
HOME PROJECTS RESOURCES SEARCH MAP

+ Advanced Search
Home
Home
View Most Recently Released Imagery
View Gallery of Imagery: A topical collection of SVS Imagery
Search Imagery by the keywords assigned to it
Search Imagery by the instruments that supplied data for a visualization product
Search Imagery by the series of visualizations that have been produced
Search Imagery by the scientist providing the data used in a visualization product
Search Imagery by the animator that created the product
Search Imagery by the identification number assigned to the visualization product
See other search options
Learn about the SVS Image Server
  + About the Server
  + Animation List
  + How to Use the Server


  + RSS Feeds
blank image
Previous Animation
Next Animation
Change in Elevation over Greenland with Alternate Color Scale

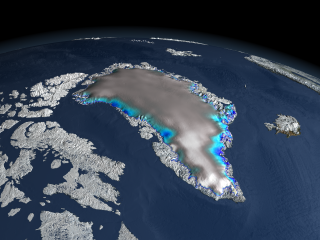
Changes in the Greenland and Antarctic ice sheets are critical in quantifying forecasts for sea level rise. Since its launch in January 2003, the ICESat elevation satellite has been measuring the change in thickness of these ice sheets. This image of Greenland shows the changes in elevation over the Greenland ice sheet between 2003 and 2006, The white regions indicate a slight thickening, while the blue shades indicate a thinning of the ice sheet. Gray indicates areas where no change in elevation was measured.

This image shows changes in the elevation over the Greenland ice sheet as colors displayed over topography of Greenland measured by ICESat.    This image shows changes in the elevation over the Greenland ice sheet as colors displayed over topography of Greenland measured by ICESat.

Available formats:
  2560 x 1920     TIFF 5 MB
  320 x 90           PNG   7 KB
  320 x 240         PNG 328 KB
  160 x 80           PNG 65 KB
  80 x 40             PNG 17 KB
  4000 x 3000     TIFF 12 MB

Color Bar for previous image noted as: This image shows changes in the elevation over the Greenland ice sheet as colors displayed over topography of Greenland measured by ICESat.    Color Bar for previous image.

Available formats:
  320 x 90           PNG   7 KB

Animation Number:3460
Animators:Cindy Starr (Lead)
 Helen-Nicole Kostis
Studio:NASA
Completed:2007-09-14
Scientists:Jay Zwally (NASA/GSFC)
 Waleed Abdalati (NASA/GSFC)
Instrument:ICESat/GLAS
Data sets:GTOPO30
 ICESat/GLAS Elevation
 Blue Marble Next Generation Seasonal Landcover
Data Collected:2003-2006
Keywords:
DLESE >> Cryology
SVS >> Ice Sheets
GCMD >> EARTH SCIENCE >> Cryosphere
GCMD >> EARTH SCIENCE >> Cryosphere >> Snow/Ice
GCMD >> EARTH SCIENCE >> Cryosphere >> Glaciers/Ice Sheets >> Glacier Elevation/Ice Sheet Elevation
GCMD >> EARTH SCIENCE >> Cryosphere >> Glaciers/Ice Sheets >> Glacier Topography/Ice Sheet Topography
GCMD >> EARTH SCIENCE >> Cryosphere >> Glaciers/Ice Sheets >> Ice Sheets
 
 
Please give credit for this item to
NASA/Goddard Space Flight Center Scientific Visualization Studio
The Next Generation Blue Marble data is courtesy of Reto Stockli (NASA/GSFC).


Back to Top

USA.gov logo - the U.S. Government's official Web portal. + Privacy Policy and Important Notices
+ Reproduction Guidelines
NASA NASA Official:
SVS Contact:
Curator: