Change in Elevation over Greenland
|
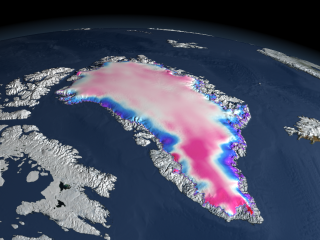
Changes in the Greenland and Antarctic ice sheets are critical in quantifying forecasts for sea level rise. Since its launch in January 2003, the ICESat elevation satellite has been measuring the change in thickness of these ice sheets. This image of Greenland shows the changes in elevation over the Greenland ice sheet between 2003 and 2006, The pink and red regions indicate a slight thickening, while the blue and purple shades indicate a thinning of the ice sheet.
|
|
|
|
This image portrays changes in the elevation over the Greenland ice sheet onto topography of Greenland measured by ICESat.
Available formats:
2560 x 1920
TIFF
5 MB
1280 x 960
TIFF
1 MB
640 x 480
TIFF
427 KB
320 x 240
PNG
318 KB
160 x 80
PNG
70 KB
80 x 40
PNG
18 KB
|
|
|
|
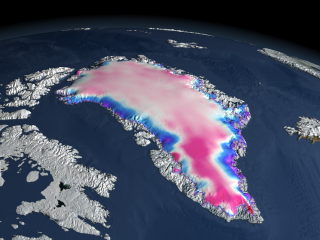
This image portrays changes in the elevation over the Greenland ice sheet onto GTOPO30 elevation.
Available formats:
2560 x 1920
TIFF
6 MB
1280 x 960
TIFF
1 MB
640 x 480
TIFF
442 KB
320 x 240
PNG
324 KB
|
|

|
|
This colorbar represents the changes in elevation measured over Greenland. Warm colors indicate thickening and cool colors indicate thinning. Areas of no change are white.
Available formats:
320 x 90
PNG
8 KB
|
|
|
Back to Top
|

