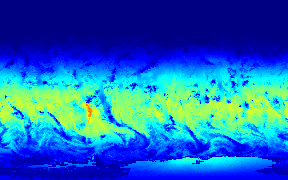
Daily Erythemal Index (UV exposure) for 2000-2001 (WMS)
|
The Erythemal Index is a measure of ultraviolet (UV) radiation at ground level on the Earth. (The word 'erythema' means an abnormal redness of the skin, such as is caused by spending too much time in the sun--a sunburn is damage to your skin cells caused by UV radiation.) Atmospheric ozone shields life at the surface from most of the harmful components of solar radiation. Chemical processes in the atmosphere can affect the level of protection provided by the ozone in the upper atmosphere. This thinning of the atmospheric ozone in the stratosphere leads to elevated levels of UV at ground level and increases the risks of DNA damage in living organisms.
|
|
|
|
This animation shows daily erythemal index for 2000-01 through 2001-12. Data gaps have been filled and the frames have been smoothed. The image size is 288x180 pixels (288x176 pixels for the MPEG movie); each pixel corresponds to an area 1 degree in longitude by 1.25 degrees in latitude.
Duration: 24.0 seconds
Available formats:
288x176 (29.97 fps)
MPEG-1
5 MB
288x180
PNG
48 KB
80x40
PNG
6 KB
How to play our movies
|
|
This product is available through our Web Map Service.
Click here to learn more.
|
|
|
|
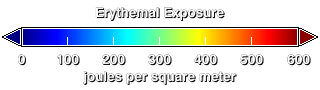
Color scale for this animation showing low exposure values as shades of blue and green and higher values as yellow, orange, or red. The units are joules per square meter.
Available formats:
320 x 90
PNG
1 KB
|
|
|
Back to Top
|


