 NCDC / Climate Monitoring / Climate of 2004 / Snow Summary / Search / Help NCDC / Climate Monitoring / Climate of 2004 / Snow Summary / Search / Help
Use these links to access detailed analyses of Global and U.S. data. 

|
 click here for animation |
As can be seen in the animated image to the left, several significant snow storms affected the continental U.S. during December while most of Canada was snow-covered for the entire month. Sea ice increased over Hudson Bay and water bodies in the Canadian interior, while the Great Lakes remained ice-free during December. A notable snow event was captured in the image to the left as snow fell in southern Texas over the Christmas holiday. Over a foot was recorded in Victoria, Texas, while Brownsville, at the southern tip of the state, received 1.5 inches. A snow storm that impacted the Ohio Valley on the 22nd and 23rd caused parts of Indiana and Kentucky to receive more than their average seasonal total in just one day. More information is also available on NCDC's December Hazards page. |

 November
| As can be seen in the animated image to the right, snow extent further increased across North America during November, with anomalously sustained snow cover for the time of year in west-central Canada and parts of the western U.S., with less than average snow cover through the month in the upper Midwest. A major snowfall event occurred across areas of the West over the Thanksgiving weekend on the 28th and 29th. More details on November snowfall will be available in the coming days. |
 click here for animation |

 October
| As can be seen in the animated image to the right, snow extent increased across North America during October, with anomalously sustained snow cover for the time of year in central and western Canada, and less than average snow cover for eastern Canada and southwestern Alaska. The first major snowfall of the season occurred for areas of the West as two large storms brought heavy snow to some western states, including California. Snow water content was also above average for basins in Wyoming, Montana and New Mexico at the end of October. |
 click here for animation |
 larger image |
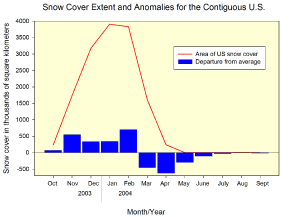
The graphs to the left show snow cover extent and departures from average for the contiguous US (top) and Alaska (bottom). Despite the advance of continental snow cover during October (as can be seen from the red line), snow cover extent was still below average for both Alaska and the contiguous US for the month (shown by the blue bars). Alaska had 51,000 km2 less snow cover than average, while the contiguous US had -92,000 km2 less than the mean. However, snow cover across Canada was greater than the October average leading to a positive anomaly of 550,000 km2 for the whole of North America. (Averages are calculated based on data from Nov 1966 to present). |
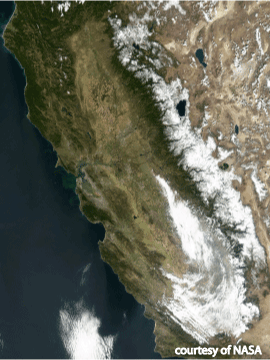
| The image to the right shows a MODIS satellite image taken on October 31st from NASA's Terra satellite. Snow is visible on the Sierra Nevada Mountains of California following the second major storm in as many weeks to hit the state. Several feet of snow fell in some mountain locations and ski-resorts were able to open early. |
 larger image |
|
See NCDC's snow climatology page for snow statistics for U.S.states and stations. |

 Early Season
| Snow cover extent began to increase in the northern areas of North America as can be seen in the animated image to the right. Some early season snowfall also occurred in the Canadian and U.S. Rockies. Anchorage, Alaska had its highest September snowfall on record (6 inches), all of which fell in one day (September 25th), also breaking the old record for the heaviest 24-hour snowfall for the month of September in Anchorage. |
 click here for animation |
 larger image |
Although some early snow fell in parts of the western mountains, monthly snow cover extent for the contiguous U.S. was near zero square kilometers as can be seen in the graph to the left. For September, the average snow cover extent is approximately 12,000 square kilometers for the nation, with an additional 184,000 km2 for Alaska. Alaska also had below average snow cover for September with 97,000 km2 less than average. |
|
See NCDC's snow climatology page for snow statistics for U.S.states and stations. |

 Questions?
For all climate questions other than questions concerning this report, please contact the National Climatic Data Center's Climate Services Division:
| Climate Services Division NOAA/National Climatic Data Center 151 Patton Avenue Asheville, NC 28801-5001 fax: 828-271-4876 phone: 828-271-4800 email: questions@ncdc.noaa.gov |
For further information on the historical climate perspective presented in this report, contact:
|
Richard Heim NOAA/National Climatic Data Center 151 Patton Avenue Asheville, NC 28801-5001 fax: 828-271-4328 email: Richard.Heim@noaa.gov |
 NCDC / Climate Monitoring / Climate of 2004 / Snow Summary / Search / Help
Downloaded Thursday, 25-Sep-2008 12:38:53 EDT
Last Updated Wednesday, 12-Jan-2005 14:29:16 EST by Anne.Waple@noaa.gov
Please see the NCDC Contact Page if you have questions or comments.

