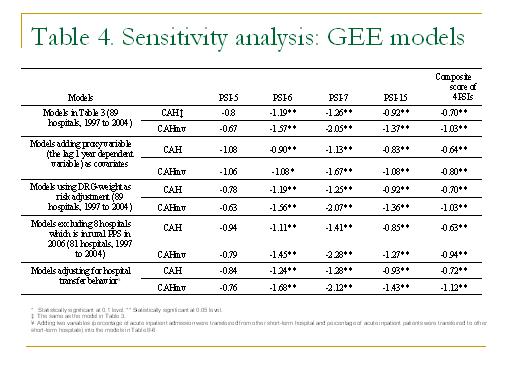
Table 4. Sensitivity Analysis: GEE models
| Models |
Critical access hospital (CAH) |
PSI-5 |
PSI-6 |
PSI-7 |
PSI-15 |
Composite score of 4 PSIs |
Models in Table 3
(89 hospitals, 1997 to 2004) |
CAH‡ |
-0.8 |
-1.19** |
-1.26** |
-0.92** |
-0.70** |
| CAHmv |
-0.67 |
-1.57** |
-2.05** |
-1.37** |
-1.03** |
Models adding proxy variable
(the lag 1 year dependent variable) as covariates |
CAH |
-1.08 |
-0.90** |
-1.13** |
-0.83** |
-0.64** |
| CAHmv |
-1.06 |
-1.08** |
-1.67** |
-1.08** |
-0.80** |
Models using DRG-weight as risk adjustment
(89 hospitals, 1997 to 2004) |
CAH |
-0.78 |
-1.19** |
-1.25** |
-0.92** |
-0.70** |
| CAHmv |
-0.63 |
-1.56** |
-2.07** |
-1.36** |
-1.03** |
Models excluding 8 hospitals which is in rural PPS in 2006
(81 hospitals, 1997 to 2004) |
CAH |
-0.94 |
-1.11** |
-1.41** |
-0.85** |
-0.63** |
| CAHmv |
-0.79 |
-1.45** |
-2.28** |
-1.27** |
-0.94** |
| Models adjusting for hospital transfer behavior¥ |
CAH |
-0.84 |
-1.24** |
-1.28** |
-0.93** |
-0.72** |
| CAHmv |
-0.76 |
-1.68** |
-2.12** |
-1.43** |
-1.12** |
* Statistically significant at 0.1 level.
** Statistically significant at 0.05 level.
++ Convergence was not achieved.
+++ Ad hospital dummy variables in cross-sectional Tobit model.
‡ The results should be interpreted with caution, given that estimations ofr some coefficients were not stable under quadchk.
¥ Adding two variables (percentage of acute inpatient admission were transferred from other short-term hospital and percentage of acute inpatient patients were transferred to other short-term hospitals) into the models in Table II-6
∏ PSI-5 are observed rate.
 Previous Slide Contents Next Slide


 540 Gaither Road Rockville, MD 20850