Urban Signatures: Sensible Heat Flux (WMS)
|
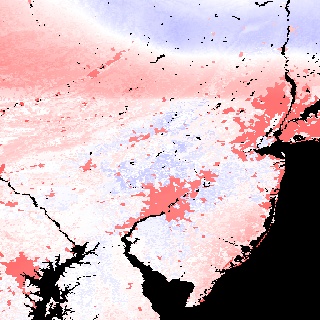
Big cities influence the environment around them. For example, urban areas are typically warmer than their surroundings. Cities are strikingly visible in computer models that simulate the Earth's land surface. This visualization shows sensible heat flux predicted by the Land Information System (LIS) for a day in June 2001. (Sensible heat flux refers to transfer of heat from the earth's surface to the air above; for further explanation see http://www.uwsp.edu/geo/faculty/ritter/geog101/textbook/energy/energy_balance.html). Sensible heat flux is higher in the cities--that is, they transfer more heat to the atmosphere--because the surface there is warmer than in the surroundings. Only part of the global computation is shown, focusing on the highly urbanized northeast corridor in the United States, including the cities of Boston, New York, Philadelphia, Baltimore, and Washington.
|
|
|
|
This image shows sensible heat flux (watts per
square meter) predicted by LIS for 2001/06/11. The warm urban areas
have higher positive flux (heat flowing towards the atmosphere)
and stand out very distinctly against their
surroundings.
Available formats:
1000 x 1000
PNG
468 KB
320 x 320
JPEG
62 KB
80 x 40
PNG
6 KB
160 x 80
PNG
22 KB
|
|
This product is available through our Web Map Service.
Click here to learn more.
|
|

|
|
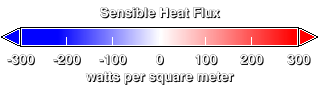
Sensible heat flux color bar. Negative values (blue) indicate heat flow from the atmosphere to the surface; positive (red)
values indicate heat flow from surface to atmosphere. The range of this color bar is greater than the flux values in the area
shown in the visualization; values in the visualization range
from -100 to +284 W/m2.
Available formats:
320 x 90
PNG
1 KB
|
|
|
Back to Top
|


