|
|
 |
ViSBARD: The Wind from the Sun
|
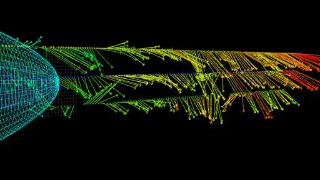
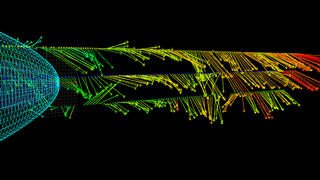
The ViSBARD (Visual System for Browsing, Analysis, and Retrieval of Data) analysis package has an option to propagate measurements carried by the solar wind. In this visualization created from ViSBARD screenshots, three spacecraft ahead of the Earth's bow shock measure the magnetic field as it is carried by the solar wind towards the Earth. Their positions as projected according to the flow speed are noted with the small glyph (Wind = yellow, Geotail = blue, IMP-8 = green). The spacecraft actually move very little over the time interval shown, but a spatial picture emerges when we use a knowledge of the wind velocity to spread the vectors out according to how they flowed past the point of observation. Arrows on the satellite glyphs indicate the magnitude and direction of the magnetic field while the color also represents the intensity (red being the highest, blue the lowest). As the wind flows, we can rapidly obtain information on the extended geometry of convected structures. The wire-frame at the left is a representation of the Earth's bow shock (about 100 Earth radii across in what is shown) that shows where the Sun's magnetic field would begin to be affected by that the Earth. (The effect of the interaction is not shown.)
|
|
|
|
ViSBARD can propagate satellite measurements of the magnetic field as the field is carried earthward by the solar wind.
Duration: 40.0 seconds
Available formats:
1280x720 (30 fps)
Frames
512x288 (30 fps)
MPEG-1
5 MB
1280x720 (29.97 fps)
MPEG-2
86 MB
320x180
JPEG
10 KB
320x180
JPEG
10 KB
How to play our movies
|
|
|
|
Projecting spacecraft field measurements along the solar wind reveals structure in the flow.
Available formats:
1280 x 720
TIFF
178 KB
160 x 80
PNG
11 KB
320 x 180
JPEG
15 KB
80 x 40
PNG
3 KB
|
|
|
Back to Top
|
|
|
|

