Skip all navigation and jump to content Jump to site navigation Jump to section navigation.
NASA Logo - Goddard Space Flight Center + Visit NASA.gov
HOME PROJECTS RESOURCES SEARCH MAP

+ Advanced Search
Home
Home
View Most Recently Released Imagery
View Gallery of Imagery: A topical collection of SVS Imagery
Search Imagery by the keywords assigned to it
Search Imagery by the instruments that supplied data for a visualization product
Search Imagery by the series of visualizations that have been produced
Search Imagery by the scientist providing the data used in a visualization product
Search Imagery by the animator that created the product
Search Imagery by the identification number assigned to the visualization product
See other search options
Learn about the SVS Image Server
  + About the Server
  + Animation List
  + How to Use the Server


  + RSS Feeds
blank image
Previous Animation
Next Animation
Global Atmospheric Sea Level Pressure during Hurricane Frances (WMS)

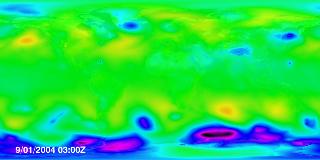
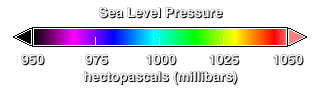
The weight of the Earth's atmosphere exerts pressure on the surface of the Earth. This pressure varies from place-to-place due the variations in the Earth's surface since higher altitudes have less atmosphere above them than lower altitudes. Atmospheric pressure also varies from time-to-time due to the uneven heating of the atmosphere by the sun and the rotation of the Earth, causing weather. In order to see the changes in pressure which affect the weather, the variation due to altitude is removed from the surface pressure, creating a quantity called sea level pressure. This animation shows the atmospheric sea level pressure for the whole globe from September 1, 2004, through September 5, 2004, during the period of Hurricane Frances in the western Atlantic Ocean and Typhoon Songda in the western Pacific Ocean. The sharp, moving low pressures areas for Frances and Songda can be clearly seen in the oceans. Even with the direct effect of altitude removed, cold high-altitude regions such as the South Pole and the Himalayan Plateau still exhibit lower-than-normal pressures, probably due to the interaction of cold air over those regions with the warmer air in the surrounding regions.

Global atmospheric sea level pressure from the 0.25 degree resolution fvGCM atmospheric model for the period 9/1/2005 through 9/5/2005.    Global atmospheric sea level pressure from the 0.25 degree resolution fvGCM atmospheric model for the period 9/1/2005 through 9/5/2005.
Duration: 20.0 seconds
Available formats:
  160x80       PNG           22 KB
  320x160     JPEG         8 KB
  80x40         PNG           6 KB
  1000x721   Frames
  640x320 (29.97 fps) MPEG-1   5 MB
How to play our movies

This product is available through our Web Map Service.   Click here to learn more.


Legend for the atmospheric sea level pressure.
   Legend for the atmospheric sea level pressure.

Available formats:
  320 x 90           PNG   1 KB

Animation Number:3182
Animators:Jeff de La Beaujardiere (SVS) (Lead)
 Horace Mitchell (SVS)
Completed:2005-06-22
Scientist:William Putman (NASA/GSFC)
Data sets:fvGCM
 fvGCM: CLDTOT (Vertically-integrated, random overlap, total cloud cover (Inst) [fraction])
 fvGCM: H300 (300 hPa Geopotential height (Inst) [m])
 fvGCM: H500 (500 hPa Geopotential height (Inst) [m])
 fvGCM: LHFX (Surface latent heat flux (Inst) [W/m2])
 fvGCM: PRECC (Convective precipitation rate (Inst) [mm/day])
 fvGCM: PRECL (Large-scale precipitation rate (Inst) [mm/day])
 fvGCM: SLP (Sea level pressure (Inst) [Pa])
 fvGCM: T2M (2 meter temperature (Inst) [K])
 fvGCM: T850 (850 hPa temperature (Inst) [K])
 fvGCM: THICK (Thickness of the 500 hPa to 1000 hPa Layer (5400m = freezing line) (Inst) [m])
 fvGCM: TQ (Total precipitable water (Inst) [kg/m2])
 fvGCM: U10M (10 meter U wind (Inst) [m/s])
 fvGCM: U200 (200 hPa U wind (Inst) [m/s])
 fvGCM: U850 (850 hPa U wind (Inst) [m/s])
 fvGCM: V10M (10 meter V wind (Inst) [m/s])
 fvGCM: V200 (200 hPa V wind (Inst) [m/s])
 fvGCM: V850 (850 hPa V wind (Inst) [m/s])
 fvGCM: PRECP (instant precip rate at output time)
 fvGCM: W10M (10 meter Vertical Velocity (Inst) [m/s])
 fvGCM: W200 (200 hPa Vertical Velocity (Inst) [m/s])
 fvGCM: W850 (850 hPa Vertical Velocity (Inst) [m/s])
Data Collected:2005-09-01T03:00 -- 2005-09-05T24:00
Series:WMS
 fvGCM
Keywords:
DLESE >> Atmospheric science
DLESE >> Natural hazards
GCMD >> EARTH SCIENCE >> Atmosphere >> Atmospheric Phenomena >> Hurricanes
GCMD >> EARTH SCIENCE >> Atmosphere >> Atmospheric Phenomena >> Typhoons
GCMD >> EARTH SCIENCE >> Atmosphere >> Atmospheric Pressure >> Sea Level Pressure
GCMD >> EARTH SCIENCE >> Human Dimensions >> Natural Hazards >> Meteorological Hazards
GCMD >> Location >> Global
SVS >> Hurricane Frances
View Animation in Google Earth Google Earth KML file is available here.
DEPC Metadata is available here.
 
 
Please give credit for this item to
NASA/Goddard Space Flight Center Scientific Visualization Studio


Back to Top

USA.gov logo - the U.S. Government's official Web portal. + Privacy Policy and Important Notices
+ Reproduction Guidelines
NASA NASA Official:
SVS Contact:
Curator: