 |
|
|
|
|
|
|
|
|
|
|
|
|
|
|
|
|
||||
| ||||||||||
|
|
|
|
Alcohol-Attributable Deaths and Years of Potential Life Lost --- United States, 2001Excessive alcohol consumption is the third leading preventable cause of death in the United States (1) and is associated with multiple adverse health consequences, including liver cirrhosis, various cancers, unintentional injuries, and violence. To analyze alcohol-related health impacts, CDC estimated the number of alcohol-attributable deaths (AADs) and years of potential life lost (YPLLs) in the United States during 2001. This report summarizes the results of that analysis, which indicated that approximately 75,766 AADs and 2.3 million YPLLs, or approximately 30 years of life lost on average per AAD, were attributable to excessive alcohol use in 2001. These results emphasize the importance of adopting effective strategies* to reduce excessive drinking, including increasing alcohol excise taxes and screening for alcohol misuse in clinical settings. Alcohol-Related Disease Impact (ARDI)* software was used to estimate the number of AADs and YPLLs. ARDI estimates AADs by multiplying the number of deaths from a particular alcohol-related condition by its alcohol-attributable fraction (AAF). Certain conditions (e.g., alcoholic cirrhosis of the liver) are, by definition, 100% alcohol attributable. For the majority of the chronic conditions profiled in ARDI, the system calculates AAFs by using relative risk estimates from meta-analyses (2,3) and prevalence data on alcohol use from the Behavioral Risk Factor Surveillance System. For some conditions, especially those with an acute onset (e.g., injuries), ARDI includes direct estimates of AAFs. Direct estimates of AAFs are based on studies assessing the proportion of deaths from a particular condition that occurred at or above a specified blood alcohol concentration (BAC) (4,5). For acute conditions, a death is alcohol attributable if the decedent (or, as in the case of motor-vehicle traffic, a driver or non-occupant) had a BAC of >0.10 g/dL. AAFs for motor-vehicle--traffic deaths are obtained from the Fatality Analysis Reporting System (6). YPLLs, a commonly used measure of premature death, are then calculated by multiplying age- and sex-specific AAD estimates by the corresponding estimate of life expectancy. For chronic conditions, AADs and YPLLs were calculated for decedents aged >20 years; for the majority of acute conditions, they were calculated for decedents aged >15 years. However, ARDI also provides estimates of AADs and YPLLs for persons aged <15 years who died from motor-vehicle crashes, child maltreatment, or low birthweight. Consistent with World Health Organization recommendations (7), the harmful and beneficial effects of alcohol use are reported separately. In 2001, an estimated 75,766 AADs and 2.3 million YPLLs were attributable to the harmful effects of excessive alcohol use (Table). Of the 75,766 deaths, 34,833 (46%) resulted from chronic conditions, and 40,933 (54%) resulted from acute conditions. Overall, 54,847 (72%) of all AADs involved males, and 4,554 (6%) involved persons aged <21 years. Of the deaths among males, 41,202 (75%) involved men aged >35 years; of those deaths, 41,202 (58%) were attributed to chronic conditions. For males and females combined, the leading chronic cause of AADs was alcoholic liver disease (12,201), and the leading acute cause of AADs was injury from motor-vehicle crashes (13,674). In addition, in 2001, an estimated 11 lives were saved because of the potential benefits of excessive alcohol use, all of which were attributable to a reduced risk for death from cholelithiasis (i.e., gall bladder disease). Of the estimated 2,279,322 YPLLs, 788,005 (35%) resulted from chronic conditions, and 1,491,317 (65%) resulted from acute conditions (Table). Overall, 1,679,414 (74%) of the total YPLLs were among males, and 271,392 (12%) involved persons aged <21 years. Of all YPLLs among males, 973,214 (58%) involved men aged >35 years, of which 53% were attributed to chronic conditions. Deaths from alcoholic liver disease resulted in 316,321 YPLLs, and deaths from motor-vehicle--traffic crashes resulted in 579,501 YPLLs. Reported by: LT Midanik, PhD, Univ of California, Berkeley, California. FJ Chaloupka, PhD, Univ of Illinois at Chicago, Chicago, Illinois. R Saitz, MD, Boston Univ, Boston, Massachusetts. TL Toomey, PhD, Univ of Minnesota, Minneapolis, Minnesota. JL Fellows, PhD, Kaiser Permanente Center for Health Research, Portland, Oregon. M Dufour, MD, CSR Incorporated, Arlington, Virginia. M Landen, MD, New Mexico Health Dept. PJ Brounstein, PhD, Substance Abuse and Mental Health Svcs Admin, Rockville, Maryland. MA Stahre, MPH, RD Brewer, MD, TS Naimi, MD, JW Miller, MD, Div of Adult and Community Health, National Center for Chronic Disease Prevention and Health Promotion, CDC. Editorial Note:In 2001, excessive alcohol use was responsible for approximately 75,000 preventable deaths and 2.3 million YPLLs in the United States. The majority of these deaths involved males (72%), and the majority of the deaths among males involved those aged >35 years (75%). Approximately half of the total deaths and two thirds of the total YPLLs resulted from acute conditions. Moreover, the BAC level used in this analysis for defining an alcohol-attributable injury death (>0.10 g/dL) is higher than the BAC level used by the National Institute for Alcohol Abuse and Alcoholism (8) to define binge drinking (>0.08 g/dL); as a result, all of the injury deaths were attributable to binge alcohol use (i.e., >5 drinks per occasion for men: >4 drinks per occasion for women). The findings described in this report are similar to recent estimates of AADs attributable to excessive drinking in the United States (1). In contrast, earlier estimates of alcohol-related deaths (9) were higher than the estimates in this analysis and other recent estimates (1) because they were calculated by using a different methodology and were based on mortality from all levels of alcohol consumption, not just excessive drinking. The 2.3 million YPLLs for excessive drinking is approximately half of the total YPLLs that were caused by smoking in 1999, the most recent year for which this estimate is available (10), even though mortality attributable to tobacco use is nearly six times higher than that attributable to excessive drinking. This difference exists because many AADs, particularly those caused by injuries, primarily affect youth and young adults, and deaths attributable to tobacco use are uncommon in this population. The findings in this report are subject to at least six limitations. First, data on alcohol use, which are used to calculate indirect estimates of AAFs, are based on self-reports and might underestimate the true prevalence of excessive alcohol use because of underreporting of alcohol use by survey respondents and sampling noncoverage. Second, the risk estimates used in ARDI were calculated by using average daily alcohol consumption levels that begin at levels greater than those typically used to define excessive drinking in the United States. Third, deaths among former drinkers, who might have discontinued their drinking because of alcohol-related health problems, are not included in the calculation of AAFs, even though some of these deaths might have been alcohol attributable. Fourth, ARDI does not include estimates of AADs for several conditions (e.g., tuberculosis, pneumonia, and hepatitis C) for which alcohol is believed to be an important risk factor but for which suitable pooled risk estimates were not available. Fifth, ARDI exclusively uses the underlying cause of death from vital statistics to identify alcohol-related conditions and does not consider contributing causes of death that might be alcohol related. Finally, age-specific estimates of AAFs were only available for motor-vehicle--traffic deaths, even though alcohol involvement varies by age, particularly for acute conditions. This analysis illustrates the magnitude of the health consequences of excessive alcohol use in the United States. In addition to estimating the national health effects of alcohol use, ARDI software also can produce state estimates of AADs and YPLLs. Such state-specific analyses are needed because the prevalence of excessive alcohol use, particularly binge drinking, is known to vary substantially by location. State-specific results also can focus discussions of effective public health strategies (e.g., increasing alcohol excise taxes and screening for alcohol misuse in clinical settings) to prevent excessive alcohol use and its adverse health and social consequences. Acknowledgment Funding for the development of ARDI software was provided by the Robert Wood Johnson Foundation, Princeton, New Jersey. References
* Available at http://www.cdc.gov/alcohol. Table 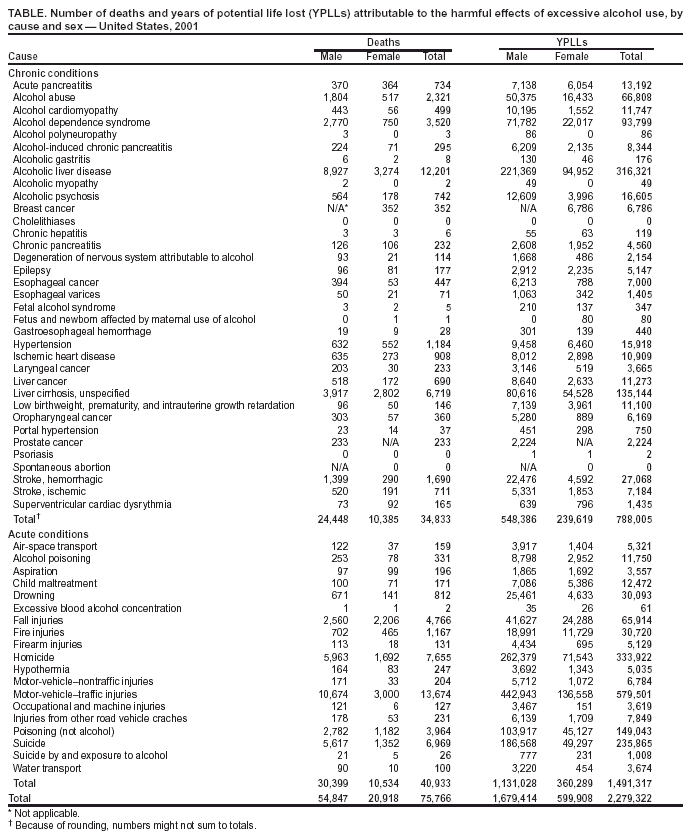 Return to top.
Disclaimer All MMWR HTML versions of articles are electronic conversions from ASCII text into HTML. This conversion may have resulted in character translation or format errors in the HTML version. Users should not rely on this HTML document, but are referred to the electronic PDF version and/or the original MMWR paper copy for the official text, figures, and tables. An original paper copy of this issue can be obtained from the Superintendent of Documents, U.S. Government Printing Office (GPO), Washington, DC 20402-9371; telephone: (202) 512-1800. Contact GPO for current prices. **Questions or messages regarding errors in formatting should be addressed to mmwrq@cdc.gov.Page converted: 9/23/2004 |
|||||||||
This page last reviewed 9/23/2004
|