Skip Navigation LinksSkip Navigation Links
Centers for Disease Control and Prevention

CDC Home Search Health Topics A-Z
MMWR

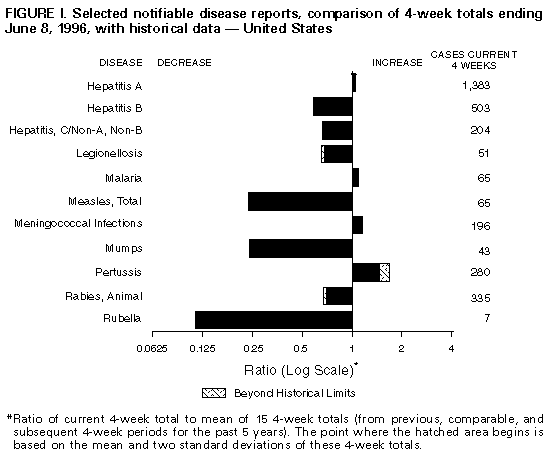
Notifiable Diseases/Deaths in Selected Cities Weekly Information

Figure_I Selected notifiable disease reports, comparison of 4-week totals ending June 8, 1996, with historical data -- United States

Table_I Summary -- cases of selected notifiable diseases, United States, cumulative, week ending June 8, 1996 (23rd Week)

Table_II Cases of selected notifiable diseases, United States, weeks ending June 8, 1996 and June 10, 1995 (23rd Week)

Table_III Cases of selected notifiable diseases preventable by vaccination, United States, weeks ending June 8, 1996 and June 10, 1995 (23rd Week)

Table_IV Deaths in 121 U.S. cities, week ending June 8, 1996 (23rd Week)
Figure_I

Figure_I
Return to top.

Table_I
Note: To print large tables and graphs users may have to change their printer settings to landscape and use a small font size.


TABLE I. Summary -- cases of specified notifiable diseases, United States,
cumulative, week ending June 8, 1996 (23rd Week)
===============================================================================
                                             Cum. 1996
------------------------------------------------------
Anthrax                                              -
Brucellosis                                         35
Cholera                                              1
Congenital rubella syndrome                          1
Cryptosporidiosis*                                 650
Diphtheria                                           1
Encephalitis:  California*                           2
               eastern equine*                       1
               St. Louis*                            -
               western equine*                       -
Hansen Disease                                      38
Hantavirus pulmonary syndrome*+                      -
HIV infection, pediatric*&                         122
Plague                                               -
Poliomyelitis, paralytic@                            -
Psittacosis                                         14
Rabies, human                                        -
Rocky Mountain spotted fever (RMSF)                110
Streptococcal toxic-shock syndrome*                 10
Syphilis, congenital**                               -
Tetanus                                              7
Toxic-shock syndrome                                62
Trichinosis                                         11
Typhoid fever                                      146
------------------------------------------------------
 * Not notifiable in all states
 + Updated weekly from reports to the Division of Viral and Rickettsial
   Diseases, National Center for Infectious Diseases (NCID).
 & Updated monthly to the Division of HIV/AIDS Prevention, National
   Center for HIV, STD, and TB Prevention (NCHSTP) (proposed), last update
   May 28, 1996.
 @ One suspected cases of polio with onset in 1996 has been reported to date.
** Updated quarterly from reports to the Division of STD Prevention,
   NCHSTP. First quarter 1996 is not yet available.
-: no reported cases
===============================================================================

Return to top.

Table_II
Note: To print large tables and graphs users may have to change their printer settings to landscape and use a small font size.

TABLE II. (page 1) Cases of selected notifiable diseases, United States, weeks ending
June 8, 1996, and June 10, 1995 (23rd Week)

                                                       Escherichia
                                                      coli O157:H7
                                                   -------------------                                Hepatitis
                          AIDS*        Chlamydia    NETSS**   PHLIS***         Gonorrhea               C\NA,NB             Legionellosis
                   -----------------   ---------   --------   --------    -------------------      ----------------      -----------------
Reporting Area       Cum.       Cum.        Cum.       Cum.       Cum.       Cum.        Cum.       Cum.       Cum.       Cum.        Cum.
                     1996       1995        1996       1996       1996       1996        1995       1996       1995       1996        1995
------------------------------------------------------------------------------------------------------------------------------------------
UNITED STATES      28,480     32,053     112,933        403        185    113,201     169,434      1,575      1,761        312         509

NEW ENGLAND         1,123      1,696       4,186         35         17      3,328       2,214         51         56         18           9
Maine                  16         26           -          3          -         19          33          -          -          1           3
N.H.                   31         47         327          1          2         65          47          3          8          -           -
Vt.                     9         14           -          5          5         26          19         21          6          2           -
Mass.                 550        792       2,953         15         10        949       1,304         24         41          9           5
R.I.                   73        121         906          4          -        230         229          3          1          6           1
Conn.                 444        696           -          7          -      2,039         582          -          -          N           N

MID. ATLANTIC       7,891      8,351      17,820         49         23     13,323      18,715        154        168         64          69
Upstate N.Y.        1,000        978           N         32         12      2,548       4,165        129         81         17          21
N.Y. City           4,489      4,473       7,743          -          -      4,200       6,966          1          1          -           1
N.J.                1,511      1,770       2,046         17          5      2,218       1,702          -         75          7          14
Pa.                   891      1,130       8,031          N          6      4,357       5,882         24         11         40          33

E.N. CENTRAL        2,298      2,543      15,945         97         48     17,351      34,064        204        143         93         172
Ohio                  521        539       3,916         36          8      2,292      10,901          6          5         41          79
Ind.                  347        255       4,521         19         10      3,112       3,423          6          -         23          38
Ill.                  974      1,101           -         22         12      7,416       8,963         24         47          2          17
Mich.                 323        494       4,101         20         18      2,911       7,885        168         91         22          18
Wis.                  133        154       3,407          N          -      1,620       2,892          -          -          5          20

W.N. CENTRAL          691        686      10,898         74         40      5,190       8,852        103         30         21          37
Minn.                 126        149           -         20         18          U       1,290          -          2          1           -
Iowa                   51         40       1,814         13          9        480         657         80          3          4          12
Mo.                   327        278       5,776         12          -      3,452       5,103         15         10          5          11
N. Dak.                 6          1           2          1          5          1          13          -          3          -           2
S. Dak.                 7          7         589          3          -         86          89          -          1          2           -
Nebr.                  49         62         762          7          2        153         451          2          8          7           9
Kans.                 125        149       1,955         18          6      1,018       1,249          6          3          2           3

S. ATLANTIC         7,305      7,937      21,685         22          4     42,111      47,665        115        124         45          82
Del.                  142        162           -          -          -        634         890          1          -          -           -
Md.                   853      1,123       2,715          N          1      5,455       5,488          -          6          6          13
D.C.                  452        507           N          -          -      1,895       2,046          -          -          3           3
Va.                   396        550       5,125          N          1      4,243       4,704          7          5         11           6
W. Va.                 49         35           -          N          -        196         293          7         23          1           3
N.C.                  355        405           -          6          2      8,359      10,676         20         27          3          16
S.C.                  387        402           -          1          -      4,900       5,358         14          9          3          15
Ga.                 1,096      1,093       5,351          4          -      9,737       9,064          -         11          -          10
Fla.                3,575      3,660       8,494         10          -      6,692       9,146         66         43         18          16

E.S. CENTRAL          953        982      12,312         12         13     12,332      18,258        316        557         25          16
Ky.                   153        118       2,957          -          1      1,808       2,000         11         15          3           5
Tenn.                 352        402       5,656          5         12      4,843       5,888        264        540         10           7
Ala.                  278        261       3,699          3          -      5,681       7,123          2          2          1           3
Miss.                 170        201           U          4          -          U       3,247         39          -         11           1

W.S. CENTRAL        2,656      2,490       5,818         13          4      8,169      23,010        180        102          2          11
Ark.                  121        108           -          6          2      1,269       2,298          1          2          -           4
La.                   656        360       2,926          4          2      3,284       5,215         73         62          -           2
Okla.                  96        130       2,892          2          -      1,788       2,137         60         23          2           3
Tex.                1,783      1,892           -          1          -      1,828      13,360         46         15          -           2

MOUNTAIN              811      1,047       4,214         38         16      3,116       3,994        276        214         17          60
Mont.                  10          8           -          4          -         13          38          9          9          1           4
Idaho                  19         24         654         11          4         38          56         70         29          -           1
Wyo.                    2          7         291          -          -         12          22         87         85          2           4
Colo.                 248        340           -         14          5        768       1,294         25         32          6          26
N. Mex.                45         81           -          2          -        366         457         34         30          1           4
Ariz.                 240        298       2,199          N          7      1,647       1,421         34         14          4           5
Utah                   90         58         254          5          -         49          98         11          7          1           3
Nev.                  157        231         816          2          -        223         608          6          8          2          13

PACIFIC             4,752      6,321      20,055         63         20      8,281      12,662        176        367         27          53
Wash.                 366        457       4,439         15          5        989       1,077         29        102          1           6
Oreg.                 223        187         117         19         10        246         202          3         24          -           -
Calif.              4,074      5,511      14,614         28          -      6,728      10,775         61        231         26          42
Alaska                 11         45         394          1          -        183         327          2          1          -           -
Hawaii                 78        121         491          N          5        135         281         81          9          -           5

Guam                    3          -         102          N          -         24          55          1          3          -           1
P.R.                  426      1,332           N          9          U        136         252         30         74          -           -
V.I.                    9         19           N          -          U          -          20          -          -          -           -
Amer. Samoa             -          -           -          -          U          -           8          -          -          -           -
C.N.M.I.                -          -           N          -          U         11          13          -          -          -           -
------------------------------------------------------------------------------------------------------------------------------------------
N: Not notifiable    U: Unavailable    -: no reported cases    C.N.M.I.: Commonwealth of North Mariana Islands

  * Updated monthly to the Division of HIV/AIDS Prevention, National Center for HIV, STD, and TB Prevention (proposed), last update
    May 28, 1996.
 ** National Electronic Telecommunications System for Surveillance.
*** Public Health Laboratory Information System.

=======================================================================================================================================================

TABLE II. (page 2) Cases of selected notifiable diseases, United States, weeks ending
June 8, 1996, and June 10, 1995 (23rd Week)

                                                                  Meningococcal             Syphilis
                          Lyme                 Malaria               Disease         (Primary & Secondary)     Tuberculosis           Rabies, Animal
                    ----------------       ----------------      ----------------    ---------------------   -----------------       ----------------
Reporting Area       Cum.       Cum.        Cum.       Cum.       Cum.       Cum.        Cum.       Cum.       Cum.       Cum.        Cum.       Cum.
                     1996       1995        1996       1995       1996       1995        1996       1995       1996       1995        1996       1995
-----------------------------------------------------------------------------------------------------------------------------------------------------
UNITED STATES       1,564      2,291         445        447      1,684      1,598       4,370      7,407      7,091      7,643       2,275      3,256

NEW ENGLAND            78        230          14         18         60         76          70         91        170        178         268        764
Maine                   3          3           3          1         10          5           -          2          4          -           -          -
N.H.                    2         12           1          1          2         15           1          1          5          5          36         88
Vt.                     -          3           2          -          3          6           -          -          -          1          77        105
Mass.                  30         18           5          5         23         23          32         35         75         99          49        276
R.I.                   21         39           3          2          -          -           1          1         20         18          21        123
Conn.                  22        155           -          9         22         27          36         52         66         55          85        172

MID. ATLANTIC       1,289      1,663         104        109        135        201         200        412      1,244      1,594         361        948
Upstate N.Y.          692        920          28         21         41         61          31         38        132        173         205        542
N.Y. City             158        161          43         54         21         25          65        213        677        853           -          -
N.J.                   86        184          28         23         37         52          55         81        296        294          67        170
Pa.                   353        398           5         11         36         63          49         80        139        274          89        236

E.N. CENTRAL           19         83          38         61        215        236         693      1,173        781        641          19         11
Ohio                   15          7           6          3         84         63         247        403        127        117           4          1
Ind.                    4          7           7          4         35         33         108        109         85         61           1          -
Ill.                    -          5           8         39         46         66         227        444        489        439           1          3
Mich.                   -          1          11          9         27         43          41        130         39          -           7          6
Wis.                    U         63           6          6         23         31          70         87         41         24           6          1

W.N. CENTRAL           44         33          12         10        129         90         182        364        190        264         211        155
Minn.                   1          -           3          3         15         16          27         21         38         58          12          9
Iowa                   16          1           2          1         28         16          10         27         26         35         114         47
Mo.                     7         15           5          4         58         33         136        300         83         97          12         17
N. Dak.                 -          -           -          -          2          1           -          -          2          1          23         16
S. Dak.                 -          -           -          -          3          4           -          -         13         10          37         42
Nebr.                   -          2           -          2         10          8           5          7          7         16           3          -
Kans.                  20         15           2          -         13         12           4          9         21         47          10         24

S. ATLANTIC            65        191         105         92        372        262       1,684      1,879      1,138      1,230       1,117        972
Del.                    2         19           2          1          2          3          17          7         20         46          30         51
Md.                    28        122          21         23         32         18         263        189        117        183         273        202
D.C.                    1          1           4          9          6          2          82         57         65         44           2          8
Va.                     2         12          11         17         31         30         210        295         82        105         239        177
W. Va.                  4         12           1          1          8          4           1          1         26         45          42         44
N.C.                   16         14          10          7         44         45         485        518        183        130         287        191
S.C.                    2          5           3          -         35         33         205        292         40        137          36         59
Ga.                     -          4           8         10         88         56         279        340        301         12         132        136
Fla.                   10          2          45         24        126         71         142        180        304        528          76        104

E.S. CENTRAL           24         13          11          9        101         97         766      1,721        586        607          80        117
Ky.                     6          3           1          -         18         25          63         93        113        131          20          8
Tenn.                   7          7           5          4         10         29         459        372        168        204          30         47
Ala.                    1          1           2          5         36         24         244        269        189        172          30         60
Miss.                  10          2           3          -         37         19           U        987        116        100           -          2

W.S. CENTRAL           13         42          11          8        207        191         521      1,390        869        994          25         65
Ark.                    7          2           -          1         27         21         134        206         37         90           3         22
La.                     -          -           1          1         36         27         245        486          U         92          12         25
Okla.                   2         17           -          -         17         22          68         76         34          -          10         18
Tex.                    4         23          10          6        127        121          74        622        798        812           -          -

MOUNTAIN                -          2          28         28         99        121          56        113        222        251          43         55
Mont.                   -          -           2          2          3          2           -          3          7          3           8         20
Idaho                   -          -           -          1         11          5           1          -          4          6           -          -
Wyo.                    -          1           2          -          3          5           1          -          3          1          13         17
Colo.                   -          -          14         16         17         29          16         65         33          5           4          -
N. Mex.                 -          -           1          3         19         24           -          4         39         40           1          3
Ariz.                   -          -           3          3         28         42          35         18         90        134          15         13
Utah                    -          -           4          2         10          7           -          4         10         10           -          1
Nev.                    -          1           2          1          8          7           3         19         36         52           2          1

PACIFIC                32         34         122        112        366        324         198        264      1,891      1,884         151        169
Wash.                   1          2           8         11         51         54           3          7        111        122           -          2
Oreg.                   7          2           9          6         67         59           5          6         45         23           -          -
Calif.                 23         30          99         87        244        204         190        250      1,640      1,628         143        160
Alaska                  -          -           2          1          2          5           -          1         27         34           8          7
Hawaii                  1          -           4          7          2          2           -          -         68         77           -          -

Guam                    -          -           -          -          1          2           2          2         35         52           -          -
P.R.                    -          -           -          1          3         13          66        151         58         86          22         28
V.I.                    -          -           -          -          -          -           -          1          -          -           -          -
Amer. Samoa             -          -           -          -          -          -           -          -          -          3           -          -
C.N.M.I.                -          -           -          -          -          -           1          3          -         13           -          -

-----------------------------------------------------------------------------------------------------------------------------------------------------
N: Not notifiable    U: Unavailable    -: no reported cases

=======================================================================================================================================================

Return to top.

Table_III
Note: To print large tables and graphs users may have to change their printer settings to landscape and use a small font size.

TABLE III. (page 1) Cases of selected notifiable diseases preventable by vaccination, United
States, weeks ending June 8, 1996, and June 10, 1995 (23rd Week)

                                                Hepatitis (Viral), by type                         Measles (Rubeola)
                     H. influenzae,       ---------------------------------------        -------------------------------------
                        invasive                  A                     B                  Indigenous            Imported**
                    ----------------      -----------------     -----------------        ---------------       ---------------
Reporting Area       Cum.       Cum.        Cum.       Cum.       Cum.       Cum.                   Cum.                  Cum.
                     1996*      1995        1996       1995       1996       1995        1996       1996       1996       1996
------------------------------------------------------------------------------------------------------------------------------
UNITED STATES         570        600       11309     11,504      3,871      4,325           7        160          -         18

NEW ENGLAND            13         31         140        102         62        100           -          6          -          2
Maine                   2          3          11         14          2          6           -          -          -          -
N.H.                    7          7           6          5          5         11           -          -          -          -
Vt.                     -          1           3          3          3          1           -          1          -          -
Mass.                   4          7          69         43         19         33           -          4          -          2
R.I.                    -          -           6         11          6          8           -          -          -          -
Conn.                   -         13          45         26         27         41           -          1          -          -

MID. ATLANTIC          87         69         684        747        584        600           -          4          -          4
Upstate N.Y.           27         20         181        168        152        143           -          -          -          -
N.Y. City              12         16         290        369        279        207           -          4          -          3
N.J.                   31          9         133         96         99        149           -          -          -          -
Pa.                    17         24          80        114         54        101           -          -          -          1

E.N. CENTRAL           78        109         956      1,521        417        501           -          4          -          3
Ohio                   49         51         422        875         57         56           -          2          -          -
Ind.                    6         15         152         65         70        100           -          -          -          -
Ill.                   14         27         160        293         78        133           -          1          -          1
Mich.                   4         14         159        176        186        179           -          -          -          2
Wis.                    5          2          63        112         26         33           -          1          -          -

W.N. CENTRAL           25         33         890        704        226        276           1         16          -          1
Minn.                  10         14          48         66         19         21           -         13          -          1
Iowa                    7          2         204         38         70         21           -          -          -          -
Mo.                     5         13         402        503        106        200           -          2          -          -
N. Dak.                 -          -          22         13          -          3           -          -          -          -
S. Dak.                 1          -          35         17          -          1           -          -          -          -
Nebr.                   1          2         103         20          8         14           -          -          -          -
Kans.                   1          2          76         47         23         16           1          1          -          -

S. ATLANTIC           138        152         512        508        619        591           -          3          -          2
Del.                    1          -           6          7          1          4           -          1          -          -
Md.                    32         46          97         89        133        118           -          2          -          -
D.C.                    5          -          15          5         15         10           -          -          -          -
Va.                     4         16          67         85         65         40           -          -          -          2
W. Va.                  4          6          10         11         14         29           -          -          -          -
N.C.                   14         20          54         55        155        137           -          -          -          -
S.C.                    3          -          29         19         40         24           -          -          -          -
Ga.                    64         31          15         43          7         50           -          -          -          -
Fla.                   11         33         219        194        189        179           -          -          -          -

E.S. CENTRAL           10          4         795        586        357        444           -          -          -          -
Ky.                     2          1          15         30         28         45           -          -          -          -
Tenn.                   2          -         556        473        221        345           -          -          -          -
Ala.                    5          3          96         47         24         54           -          -          -          -
Miss.                   1          -         128         36         84          -           -          -          -          -

W.S. CENTRAL           23         30       1,955      1,257        377        463           -          -          -          2
Ark.                    -          4         233        110         31         20           -          -          -          -
La.                     1          1          60         42         52         77           U          -          U          -
Okla.                  21         16         855        289         47         69           -          -          -          -
Tex.                    1          9         807        816        247        297           -          -          -          2

MOUNTAIN               62         60       1,810      1,818        474        357           6         21          -          1
Mont.                   -          -          60         30          4          9           -          -          -          -
Idaho                   1          2         126        184         56         43           U          1          U          -
Wyo.                   32          3          18         64         14          9           U          -          U          -
Colo.                   5          9         169        225         62         59           1          5          -          1
N. Mex.                 7          9         225        360        152        145           -          -          -          -
Ariz.                   9         17         713        515        116         48           5          8          -          -
Utah                    6          6         411        383         55         28           -          3          -          -
Nev.                    2         14          88         57         15         16           -          4          -          -

PACIFIC               134        112       3,567      4,261        755        993           -        106          -          3
Wash.                   2          5         253        296         49         73           -         45          -          -
Oreg.                  18         14         495        865         35         55           -          1          -          -
Calif.                111         91       2,754      2,993        666        850           -          2          -          2
Alaska                  1          -          25         16          3          6           -         58          -          -
Hawaii                  2          2          40         91          2          9           U          -          U          1

Guam                    -          -           2          2          -          -           U          -          U          -
P.R.                    1          3          59         35        207        163           -          1          -          -
V.I.                    -          -           -          -          -          2           U          -          U          -
Amer. Samoa             -          -           -          5          -          -           U          -          U          -
C.N.M.I.               10          5           1         15          5          7           U          -          U          -
------------------------------------------------------------------------------------------------------------------------------

 * Of 128 cases reported among children aged <5 years, serotype was reported for 30 and of those, 6 were type b.
** For imported measles, cases include only those resulting from importation from other countries.
N: Not notifiable    U: Unavailable     -: no reported cases
============================================================================================================================================

TABLE III. (page 2) Cases of selected notifiable diseases preventable by vaccination, United
States, weeks ending June 8, 1996, and June 10, 1995 (23rd Week)

               Measles (Rubeola), cont'd.
               --------------------------
                           Total                      Mumps                           Pertussis                          Rubella
               --------------------------   --------------------------       ---------------------------       ---------------------------
Reporting Area       Cum.       Cum.                   Cum.       Cum.                   Cum.       Cum.                  Cum.        Cum.
                     1996       1995        1996       1996       1995       1996        1996       1995       1996       1996        1995
------------------------------------------------------------------------------------------------------------------------------------------
UNITED STATES         178        213          16        295        454         74       1,286      1,169          1         75          53

NEW ENGLAND             8          4           -          -          7          2         202        182          -         11           7
Maine                   -          -           -          -          4          -           8         18          -          -           1
N.H.                    -          -           -          -          -          2          20         13          -          -           1
Vt.                     1          -           -          -          -          -           7          8          -          2           -
Mass.                   6          2           -          -          2          -         164        136          -          7           2
R.I.                    -          2           -          -          -          -           -          -          -          -           -
Conn.                   1          -           -          -          1          -           3          7          -          2           3

MID. ATLANTIC           8          3           2         43         64          3         100        110          -          4           7
Upstate N.Y.            -          -           1         11         15          1          56         60          -          3           1
N.Y. City               7          -           -         11          8          -          14         15          -          1           5
N.J.                    -          3           -          -          8          -           -          6          -          -           1
Pa.                     1          -           1         21         33          2          30         29          -          -           -

E.N. CENTRAL            7          8           1         68         73          4         154        128          -          3           -
Ohio                    2          1           -         27         22          3          72         44          -          -           -
Ind.                    -          -           -          5          5          -          12         11          -          -           -
Ill.                    2          -           -         16         23          -          51         28          -          1           -
Mich.                   2          5           1         20         23          1          14         33          -          2           -
Wis.                    1          2           -          -          -          -           5         12          -          -           -

W.N. CENTRAL           17          1           1          4         28          2          61         75          -          1           -
Minn.                  14          -           -          1          2          2          42         27          -          -           -
Iowa                    -          -           -          -          8          -           2          2          -          1           -
Mo.                     2          1           1          1         15          -          11         18          -          -           -
N. Dak.                 -          -           -          2          -          -           -          6          -          -           -
S. Dak.                 -          -           -          -          -          -           1          7          -          -           -
Nebr.                   -          -           -          -          3          -           1          5          -          -           -
Kans.                   1          -           -          -          -          -           4         10          -          -           -

S. ATLANTIC             5          3           8         40         67         20         144        102          -         12          16
Del.                    1          -           -          -          -          1           9          5          -          -           -
Md.                     2          -           -         12         23          1          52         13          -          -           -
D.C.                    -          -           -          -          -          -           -          2          -          1           -
Va.                     2          -           -          3         13         13          18          8          -          -           -
W. Va.                  -          -           -          -          -          -           2          -          -          -           -
N.C.                    -          -           8          8         16          4          29         50          -          -           -
S.C.                    -          -           -          5          7          1           6         10          -          1           -
Ga.                     -          -           -          2          -          -           7          -          -          -           -
Fla.                    -          3           -         10          8          -          21         14          -         10          16

E.S. CENTRAL            -          -           3         16         12          1          44         33          -          -           -
Ky.                     -          -           -          -          -          -          23          6          -          -           -
Tenn.                   -          -           -          2          -          1          14          4          -          -           -
Ala.                    -          -           -          4          4          -           4         23          -          -           -
Miss.                   -          -           3         10          8          -           3          -          N          N           N

W.S. CENTRAL            2         11           -         13         29          -          25         61          -          2           2
Ark.                    -          2           -          -          5          -           2          7          -          -           -
La.                     -          9           U         10          7          U           4          4          U          1           -
Okla.                   -          -           -          -          -          -           4          9          -          -           -
Tex.                    2          -           -          3         17          -          15         41          -          1           2

MOUNTAIN               22         65           1         20         22          1         152        278          1          4           4
Mont.                   -          -           -          -          1          -           4          3          -          -           -
Idaho                   1          -           U          -          2          U          65         73          U          -           -
Wyo.                    -          -           U          -          -          U           -          1          U          -           -
Colo.                   6         25           1          2          -          1          20         44          1          2           -
N. Mex.                 -         29           N          N          N          -          29         33          -          -           -
Ariz.                   8         10           -          1          2          -          11        111          -          1           3
Utah                    3          -           -          2         10          -           6         10          -          -           1
Nev.                    4          1           -         15          7          -          17          3          -          1           -

PACIFIC               109        118           -         91        152         41         404        200          -         38          17
Wash.                  45         16           -          9         10         11         157         34          -          1           -
Oreg.                   1          1           N          N          N          -          27         14          -          1           1
Calif.                  4         99           -         65        126         30         209        134          -         34          13
Alaska                 58          -           -          2         12          -           2          -          -          -           -
Hawaii                  1          2           U         15          4          U           9         18          U          2           3

Guam                    -          -           U          3          3          U           -          2          U          -           1
P.R.                    1          9           -          1          1          -           1          8          -          -           -
V.I.                    -          -           U          -          2          U           -          -          U          -           -
Amer. Samoa             -          -           U          -          -          U           -          -          U          -           -
C.N.M.I.                -          -           U          -          -          U           -          -          U          -           -

------------------------------------------------------------------------------------------------------------------------------------------
N: Not notifiable    U: Unavailable     -: no reported cases

============================================================================================================================================

Return to top.

Table_IV
Note: To print large tables and graphs users may have to change their printer settings to landscape and use a small font size.

TABLE IV. Deaths in 121 U.S. cities* week ending
June 8, 1996 (23rd Week)
===================================================================================================================================
                                                 All Causes, By Age (Years)
                          ------------------------------------------------------------------------        P&I**
Reporting Area            All Ages         >=65        45-64       25-44         1-24           <1        Total
---------------------------------------------------------------------------------------------------------------
NEW ENGLAND                    595          394          102          66           15           18           20
Boston, Mass.                  183          111           36          24            5            7            3
Bridgeport, Conn.               40           30            6           1            2            1            -
Cambridge, Mass.                23           14            6           3            -            -            2
Fall River, Mass.               27           22            5           -            -            -            -
Hartford, Conn.                 42           25           10           5            2            -            -
Lowell, Mass.                   16           14            -           2            -            -            1
Lynn, Mass.                     15           13            2           -            -            -            4
New Bedford, Mass.              25           18            2           3            2            -            -
New Haven, Conn.                36           18            7           6            1            4            -
Providence, R.I.                60           41           12           6            -            1            1
Somerville, Mass.                4            4            -           -            -            -            -
Springfield, Mass.              46           33            6           4            1            2            4
Waterbury, Conn.                23           15            4           1            2            1            -
Worcester, Mass.                55           36            6          11            -            2            5

MID. ATLANTIC                2,444        1,636          487         230           55           36          115
Albany, N.Y.                    54           35           11           3            3            2            4
Allentown, Pa.                  26           24            2           -            -            -            -
Buffalo, N.Y.                    U            U            U           U            U            U            U
Camden, N.J.                    32           22            5           3            1            1            1
Elizabeth, N.J.                 24           19            3           2            -            -            -
Erie, Pa.***                    47           39            6           2            -            -            2
Jersey City, N.J.               36           17           10           9            -            -            -
New York City, N.Y.          1,250          826          249         136           19           20           42
Newark, N.J.                    72           35           22           8            6            1            3
Paterson, N.J.                   U            U            U           U            U            U            U
Philadelphia, Pa.              499          309          113          48           19           10           33
Pittsburgh, Pa.***              51           38           10           -            1            2            3
Reading, Pa.                    15            9            3           2            1            -            2
Rochester, N.Y.                113           91           15           6            1            -            6
Schenectady, N.Y.               24           20            4           -            -            -            1
Scranton, Pa.***                30           24            6           -            -            -            1
Syracuse, N.Y.                 101           74           18           5            4            -            7
Trenton, N.J.                   25           16            6           3            -            -            5
Utica, N.Y.                     17           13            2           2            -            -            -
Yonkers, N.Y.                   28           25            2           1            -            -            5

E.N. CENTRAL                 2,187        1,442          416         198           58           68          124
Akron, Ohio                     60           42           12           4            1            1            1
Canton, Ohio                    25           15            6           4            -            -            3
Chicago, Ill.                  454          255          103          58           25           12           30
Cincinnati, Ohio                 U            U            U           U            U            U            U
Cleveland, Ohio                153           96           29          17            6            5            3
Columbus, Ohio                 219          138           41          26            3           11           20
Dayton, Ohio                   104           76           18           7            -            3           10
Detroit, Mich.                 224          124           53          29            5            9            9
Evansville, Ind.                49           37           10           2            -            -            -
Fort Wayne, Ind.                78           55           18           3            2            -            3
Gary, Ind.                      19           12            3           3            1            -            -
Grand Rapids, Mich.             61           44            8           3            3            3            6
Indianapolis, Ind.             244          156           51          19            5           13            9
Madison, Wis.                   47           32           11           2            -            2            7
Milwaukee, Wis.                139          107           22           5            1            4            6
Peoria, Ill.                    49           38            4           4            2            1            5
Rockford, Ill.                  40           34            4           1            -            1            3
South Bend, Ind.                52           40            6           3            2            1            3
Toledo, Ohio                   112           92           12           6            1            1            3
Youngstown, Ohio                58           49            5           2            1            1            3

W.N. CENTRAL                   833          561          150          63           21           22           52
Des Moines, Iowa                90           69           15           4            2            -           10
Duluth, Minn.                   23           17            4           1            -            1            2
Kansas City, Kans.              30           15            7           6            2            -            1
Kansas City, Mo.                96           59           13           4            4            -            8
Lincoln, Nebr.                  47           35           10           2            -            -            2
Minneapolis, Minn.             205          137           40          16            4            8           14
Omaha, Nebr.                    68           41           15           6            2            4            3
St. Louis, Mo.                 141          100           23          11            5            2            3
St. Paul, Minn.                 56           37            8           4            -            7            5
Wichita, Kans.                  77           51           15           9            2            -            4

S. ATLANTIC                  1,138          707          218         142           43           28           52
Atlanta, Ga.                   126           67           25          23            5            6            4
Baltimore, Md.                 206          115           42          36            9            4           11
Charlotte, N.C.                 74           44           17           8            1            4            6
Jacksonville, Fla.             129           82           20          20            5            2            4
Miami, Fla.                    121           74           30          13            2            2            2
Norfolk, Va.                    51           38            6           3            2            2            2
Richmond, Va.                   80           53           15           8            4            -            3
Savannah, Ga.                   44           31            7           4            1            1            1
St. Petersburg, Fla.            69           38           16           9            2            4            3
Tampa, Fla.                    225          163           35          18            6            3           16
Washington, D.C.                 U            U            U           U            U            U            U
Wilmington, Del.                13            2            5           -            6            -            -

E.S. CENTRAL                   666          416          164          68           13            5           43
Birmingham, Ala.               113           65           31          12            3            2            3
Chattanooga, Tenn.              43           24           10           7            2            -            2
Knoxville, Tenn.                64           40           15           5            2            2            7
Lexington, Ky.                  82           49           21          10            2            -            3
Memphis, Tenn.                 161          104           41          14            1            1           13
Mobile, Ala.                    44           32            9           3            -            -            4
Montgomery, Ala.                16           13            2           1            -            -            2
Nashville, Tenn.               143           89           35          16            3            -            9

W.S. CENTRAL                 1,518          987          309         135           46           40           81
Austin, Tex.                    56           41            8           4            2            1            6
Baton Rouge, La.                71           45           19           1            5            1            2
Corpus Christi, Tex.            53           38           12           3            -            -            2
Dallas, Tex.                   200          121           41          28            9            1            2
El Paso, Tex.                   86           58           19           5            1            2            9
Ft. Worth, Tex.                 97           50           22           7            6           12            2
Houston, Tex.                  361          223           83          35           11            9           24
Little Rock, Ark.               64           40           14           5            2            3            2
New Orleans, La.               124           77           21          16            6            4            -
San Antonio, Tex.              202          139           41          17            2            3           10
Shreveport, La.                 79           63            6           6            2            2           10
Tulsa, Okla.                   125           92           23           8            -            2           12

MOUNTAIN                       907          586          170         102           30           18           62
Albuquerque, N.M.               99           64           24           7            3            1            4
Colo. Springs, Colo.            49           30            7           9            2            1            2
Denver, Colo.                   96           58           19          12            3            4            6
Las Vegas, Nev.                148           89           29          19            8            2            8
Ogden, Utah                     31           28            3           -            -            -            1
Phoenix, Ariz.                 195          117           34          31            6            7           22
Pueblo, Colo.                   20           12            6           2            -            -            2
Salt Lake City, Utah           101           65           18          10            5            3            6
Tucson, Ariz.                  168          123           30          12            3            -           11

PACIFIC                      2,135        1,512          344         175           55           49          193
Berkeley, Calif.                14           11            3           -            -            -            1
Fresno, Calif.                  71           54            9           5            1            2            8
Glendale, Calif.                33           29            3           1            -            -            3
Honolulu, Hawaii                68           48           13           4            2            1            2
Long Beach, Calif.              71           58            5           4            2            2           10
Los Angeles, Calif.            712          490          109          80           20           13           49
Pasadena, Calif.                19           13            3           1            1            1            1
Portland, Oreg.                142          105           30           4            2            1           10
Sacramento, Calif.             180          133           22          13            6            6           22
San Diego, Calif.              147           98           27          11            5            6           14
San Francisco, Calif.          135           84           32          16            2            1           20
San Jose, Calif.               240          176           40          12            6            6           29
Santa Cruz, Calif.              25           20            3           1            1            -            2
Seattle, Wash.                 125           79           25          14            4            3            9
Spokane, Wash.                  56           45            9           -            1            1            5
Tacoma, Wash.                   97           69           11           9            2            6            8

TOTAL                   12,423****        8,241        2,360       1,179          336          284          742

---------------------------------------------------------------------------------------------------------------
   * Mortality data in this table are voluntarily reported from 121 cities in the United States, most of which have populations
     of 100,000 or more. A death is reported by the place of its occurrence and by the week that the death certificate was
     filed. Fetal deaths are not included.
  ** Pneumonia and influenza.
 *** Because of changes in reporting methods in these 3 Pennsylvania cities, these numbers are partial counts for the current
     week. Complete counts will be available in 4 to 6 weeks.
**** Total includes unknown ages.

U: Unavailable    -: no reported cases
===================================================================================================================================

Return to top.

Disclaimer   All MMWR HTML versions of articles are electronic conversions from ASCII text into HTML. This conversion may have resulted in character translation or format errors in the HTML version. Users should not rely on this HTML document, but are referred to the electronic PDF version and/or the original MMWR paper copy for the official text, figures, and tables. An original paper copy of this issue can be obtained from the Superintendent of Documents, U.S. Government Printing Office (GPO), Washington, DC 20402-9371; telephone: (202) 512-1800. Contact GPO for current prices.

**Questions or messages regarding errors in formatting should be addressed to mmwrq@cdc.gov.

Page converted: 09/19/98

HOME  |  ABOUT MMWR  |  MMWR SEARCH  |  DOWNLOADS  |  RSSCONTACT
POLICY  |  DISCLAIMER  |  ACCESSIBILITY

Safer, Healthier People

Morbidity and Mortality Weekly Report
Centers for Disease Control and Prevention
1600 Clifton Rd, MailStop E-90, Atlanta, GA 30333, U.S.A

USA.GovDHHS

Department of Health
and Human Services

This page last reviewed 5/2/01