 |
|
|
|
|
|
|
|
|
|
|
|
|
|
|
|
|
||||
| ||||||||||
|
|
|
|
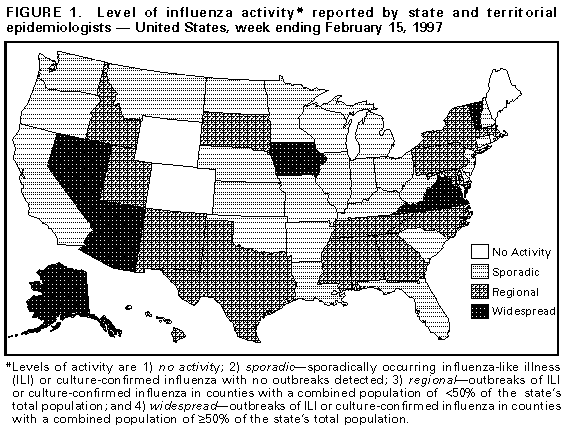
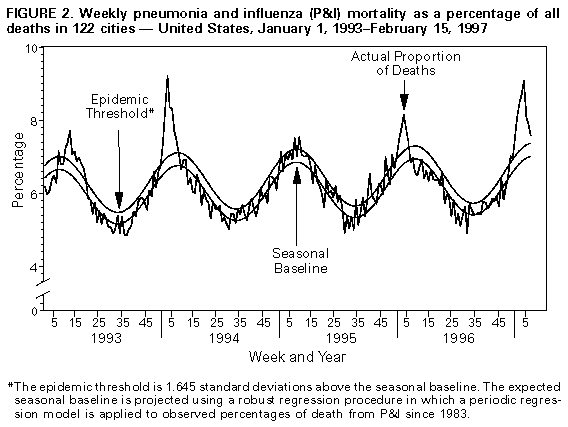
Update: Influenza Activity -- United States, 1996-97 SeasonInfluenza activity in the United States has continued to decline since mid-January 1997. The predominant viruses have been influenza type A (H3N2), although the proportion of influenza B isolates has increased since the week ending January 18. This report summarizes influenza activity in the United States from September 29, 1996, through the week ending February 15, 1997. The proportion of patients who visited 120 U.S. sentinel physicians for influenza-like illness (ILI) peaked at 7% from mid-December through the first week of January and was 3% of total visits by the week ending February 15, 1997. The proportion of visits for ILI had remained at or below the baseline level of 3% since the week ending January 25, 1997; however, the proportion of ILI visits had not yet reached baseline levels in the West South Central and Pacific regions through the week ending February 15, 1997. Influenza activity * has decreased since the week ending December 28, 1996, when state and territorial epidemiologists in 38 states reported either widespread or regional activity. For the week ending February 15, 1997, either widespread or regional influenza activity was reported in 21 states and sporadic activity was reported in 25 states and the District of Columbia (Figure_1). None of the states in the East North Central region reported regional or widespread activity for the week ending February 15. The proportion of deaths attributed to pneumonia and influenza (P&I) among 122 U.S. cities exceeded the epidemic threshold ** during the week ending December 14, 1996, and peaked at 9.1% during the week ending January 25, 1997. Since then, although the proportion of P&I deaths has declined, it has remained above the epidemic threshold for 10 consecutive weeks through the week ending February 15, 1997 (Figure_2). From September 29, 1996, through February 15, 1997, World Health Organization (WHO) collaborating laboratories in the United States reported 5050 (19.1%) influenza isolates from the total 26,430 specimens submitted for respiratory virus testing: 4714 (93.4%) were type A, and 336 (6.7%) were type B. All 1866 influenza A isolates subtyped have been A(H3N2) viruses; thus far, no A(H1N1) viruses have been reported in the United States during the 1996-97 influenza season. From September 29, 1996, through December 28, 1996, a total of 38 (1.4%) of 2811 influenza isolates were type B. Although the total number of influenza viruses isolated has declined since then, the proportion of influenza B isolates has increased. During January 26-February 15, a total of 166 (42.5%) of the 391 reported influenza isolates were type B. At least one type B isolate has been reported from each region. Reported by: Participating state and territorial epidemiologists and state public health laboratory directors. World Health Organization collaborating laboratories. Sentinel Physicians Influenza Surveillance System. Influenza Br and WHO Collaborating Center for Surveillance, Epidemiology, and Control of Influenza, Div of Viral and Rickettsial Diseases, National Center for Infectious Diseases, CDC. Editorial NoteEditorial Note: All four components of the influenza surveillance system indicate that influenza activity is declining in the United States. However, as of February 15, some states continued reporting widespread activity. Although 93% of influenza isolates for this season have been type A, an increasing proportion of influenza viruses isolated by WHO collaborating laboratories since January 1997 have been influenza type B viruses. Rapid antigen testing of nasopharyngeal swab specimens for influenza A is commercially available in many areas. The timely diagnosis of influenza A can be useful in inpatient and clinic settings to guide the selection of antiviral drugs (amantadine or rimantadine) for prophylaxis or treatment of persons at high-risk for influenza A-related complications. These drugs are 70%-90% effective in preventing influenza A infections and can reduce the severity and duration of symptoms from influenza A when administered within 48 hours of illness onset. However, they are not effective against influenza type B viruses. Early recognition of influenza A outbreaks is especially important in institutions that provide care for elderly persons because infection can spread rapidly and the impact of influenza A can be particularly severe in these settings. Administration of amantadine or rimantadine early in the course of an influenza A outbreak can control further spread of infection. Chronic-care facilities should know before an outbreak occurs which laboratories in their area perform influenza A rapid antigen testing (1-3). Influenza surveillance data collected by CDC is updated weekly throughout the influenza season. Information is available through the CDC voice information system, telephone (404) 332-4551, or the fax information system, telephone (404) 332-4565, by requesting document number 361100. References
Disclaimer All MMWR HTML versions of articles are electronic conversions from ASCII text into HTML. This conversion may have resulted in character translation or format errors in the HTML version. Users should not rely on this HTML document, but are referred to the electronic PDF version and/or the original MMWR paper copy for the official text, figures, and tables. An original paper copy of this issue can be obtained from the Superintendent of Documents, U.S. Government Printing Office (GPO), Washington, DC 20402-9371; telephone: (202) 512-1800. Contact GPO for current prices. **Questions or messages regarding errors in formatting should be addressed to mmwrq@cdc.gov.Page converted: 09/19/98 |
|||||||||
This page last reviewed 5/2/01
|