Skip Navigation LinksSkip Navigation Links
Centers for Disease Control and Prevention

CDC Home Search Health Topics A-Z
MMWR

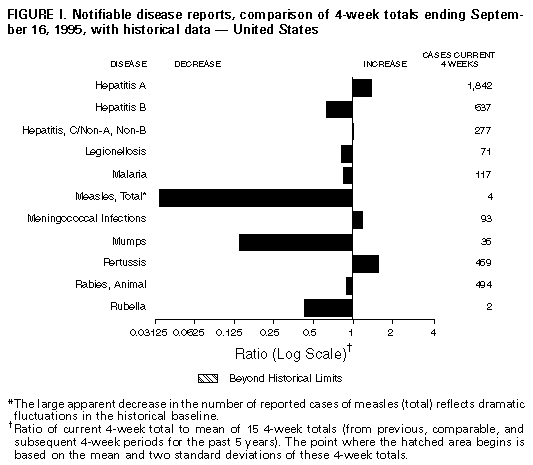
Notifiable Diseases/Deaths in Selected Cities Weekly Information

Figure_I Notifiable disease reports, comparison of 4-week totals ending September 22, 1995, with historical data -- United States

Table_I Summary -- cases of specified notifiable diseases, United States, cumulative, week ending September 16, 1995 (37th Week)

Table_II Cases of selected notifiable diseases, United States, weeks ending September 16, 1995 and September 17, 1994 (37th Week)

Table_III Deaths in 121 U.S. cities, week ending September 16, 1995 (37th Week)
Figure_I

Figure_I
Return to top.

Table_I
Note: To print large tables and graphs users may have to change their printer settings to landscape and use a small font size.


Table I. Summary -- cases of specified notifiable diseases, United States,
cumulative, week ending September 16, 1995 (37th Week)
============================================================================
                                            Cum. 1995
-----------------------------------------------------
Anthrax                                          -
Brucellosis                                     64
Cholera                                         11
Congenital rubella syndrome                      4
Diphtheria                                       -
Haemophilus influenzae*                        852
Hansen Disease                                  92
Plague                                           6
Poliomyelitis, Paralytic                         -
Psittacosis                                     50
Rabies, human                                    1
Rocky Mountain Spotted Fever                   400
Syphilis, congenital, age less than 1 year**   132
Tetanus                                         20
Toxic shock syndrome                           132
Trichinosis                                     24
Typhoid fever                                  220
-----------------------------------------------------
* Of 833 cases of known age, 198 (24%) were reported among children
   less than 5 years of age.
** Updated quarterly from reports to the Division of STD Prevention,
   National Center for Prevention Services. This total through first
   quarter 1995.
-: no reported cases
============================================================================

Return to top.

Table_II
Note: To print large tables and graphs users may have to change their printer settings to landscape and use a small font size.

TABLE II. (page 1) Cases of selected notifiable diseases, United States, weeks ending
September 16, 1995, and September 17, 1994 (37th Week)

                                                                        Hepatitis (Viral), by type
                                                     --------------------------------------------------------------
                   AIDS*          Gonorrhea                  A                     B                   C/NA,NB             Legionellosis
                   ------    -------------------     -----------------      -----------------      ----------------       ----------------
Reporting Area       Cum.       Cum.        Cum.       Cum.       Cum.       Cum.        Cum.       Cum.       Cum.       Cum.        Cum.
                     1995       1995        1994       1995       1994       1995        1994       1995       1994       1995        1994
------------------------------------------------------------------------------------------------------------------------------------------
UNITED STATES      47,385    244,636     283,390     19,074     16,874      7,032       8,107      3,034      2,957        886       1,111

NEW ENGLAND         2,412      3,726       5,566        195        212        159         250         88        113         25          43
Maine                  74         60          64         21         20          7          11          -          -          5           4
N.H.                   72         81          78          7         16         16          17         12          9          4           -
Vt.                    23         44          22          5          6          1           6          1         11          -           -
Mass.               1,014      2,026       2,224         80         83         61         148         70         73         13          27
R.I.                  184        364         336         25         19          8           6          5         20          3          12
Conn.               1,045      1,151       2,842         57         68         66          62          -          -          N           N

MID. ATLANTIC      12,777     24,654      31,774      1,130      1,203        879       1,064        283        352        133         173
Upstate N.Y.        1,634      3,846       7,440        284        420        284         282        156        168         37          40
N.Y. City           6,547      8,598      12,073        553        454        275         235          1          1          3           5
N.J.                2,983      3,162       3,608        139        220        182         280         94        153         18          33
Pa.                 1,613      9,048       8,653        154        109        138         267         32         30         75          95

E.N. CENTRAL        3,613     53,346      56,948      2,045      1,655        681         833        191        247        237         319
Ohio                  733     15,911      15,044      1,311        595         82         121          8         17        119         151
Ind.                  383      5,932       6,235        122        271        165         149          5          8         55          34
Ill.                1,525     14,682      17,578        217        421         94         222         33         65         13          29
Mich.                 721     12,691      12,624        266        199        300         271        145        157         23          59
Wis.                  251      4,130       5,467        129        169         40          70          -          -         27          46

W.N. CENTRAL        1,091     13,975      15,822      1,346        841        448         465         93         65         84          76
Minn.                 243      2,007       2,320        141        163         44          43          2         14          2           2
Iowa                   55      1,090       1,039         50         43         32          23         11          7         17          27
Mo.                   476      8,000       8,708        964        422        312         347         54         17         44          25
N. Dak.                 5         20          29         23          4          4           -          7          1          4           4
S. Dak.                11        124         148         37         24          2           -          1          -          1           1
Nebr.                  80        697         991         34        103         22          24          6         10          9          12
Kans.                 221      2,037       2,587         97         82         32          28         12         16          7           5

S. ATLANTIC        12,200     71,528      75,130        907        852        996       1,491        237        321        162         271
Del.                  220      1,565       1,368          7         20          2          11          1          1          2          31
Md.                 1,635      7,471      13,285        157        124        185         244          3         17         26          62
D.C.                  738      3,161       5,232         17         16         15          36          -          -          4           5
Va.                   965      7,620       9,403        152        119         82          92         10         20         15           6
W. Va.                 77        471         557         17         11         40          29         41         23          3           3
N.C.                  712     16,888      18,921         85         92        203         195         45         47         30          18
S.C.                  671      8,668       9,475         35         30         37          23         17          7         29           9
Ga.                 1,628     11,083           U         55         25         63         513         15        167         23          95
Fla.                5,554     14,601      16,889        382        415        369         348        105         39         30          42

E.S. CENTRAL        1,551     29,910      33,147      1,099        439        609         870        736        684         41          70
Ky.                   197      3,485       3,552         30        121         46          63         15         23          9           8
Tenn.                 638      9,811      10,572        892        189        484         749        719        647         23          36
Ala.                  411     12,007      11,357         64         71         79          58          2         14          6          11
Miss.                 305      4,607       7,666        113         58          -           -          -          -          3          15

W.S. CENTRAL        4,178     22,823      34,804      2,946      2,184      1,223         846        498        217         12          35
Ark.                  186      2,287       4,892        343        148         36          22          4          6          1           6
La.                   715      8,035       8,613         84        120        150         128        129        128          2          12
Okla.                 196      1,496       3,526        662        220        376          96        323         43          3          11
Tex.                3,081     11,005      17,773      1,857      1,696        661         600         42         40          6           6

MOUNTAIN            1,466      6,239       7,027      2,845      3,288        552         477        323        319         87          70
Mont.                  16         51          66         83         17         19          18         11          6          4          14
Idaho                  37         91          64        234        244         61          65         40         63          2           1
Wyo.                   10         38          56         87         21         16          20        132        113          7           3
Colo.                 491      2,102       2,414        389        346         88          76         50         55         33          15
N. Mex.               123        716         708        594        807        212         150         37         42          4           3
Ariz.                 392      2,334       2,279        830      1,308         83          48         31         14          9           8
Utah                   98        131         186        516        372         48          58          8         13         13           6
Nev.                  299        776       1,254        112        173         25          42         14         13         15          20

PACIFIC             8,097     18,435      23,172      6,561      6,200      1,485       1,811        585        639        105          54
Wash.                 667      1,889       2,087        566        800        134         168        151        189         19          10
Oreg.                 285        212         727      1,404        715         61         104         29         29          -           -
Calif.              6,910     15,439      19,177      4,439      4,482      1,269       1,503        373        417         81          42
Alaska                 53        498         648         31        164          9          12          1          -          -           -
Hawaii                182        397         533        121         39         12          24         31          4          5           2

Guam                    -         51          95          2         18          1           4          -          -          1           1
P.R.                1,851        361         358         82         47        525         254        240        129          -           -
V.I.                   27          6          20          -          3          2           7          -          1          -           -
Amer. Samoa             -         19          21          6          8          -           -          -          -          -           -
C.N.M.I.                -         23          41         15          6          7           1          -          -          -           -
------------------------------------------------------------------------------------------------------------------------------------------
N: Not nofifiable    U: Unavailable    -: no reported cases    C.N.M.I.: Commonwealth of North Mariana Islands

*Updated monthly to the Division of HIV/AIDS Prevention, National Center for Prevention Services, last update August 31, 1995.

=============================================================================================================================================================================

TABLE II. (page 2) Cases of selected notifiable diseases, United States, weeks ending
September 16, 1995, and September 17, 1994 (37th Week)

                                                                                        Measles (Rubeola)
                                                                  ------------------------------------------------------------
                          Lyme                  Malaria             Indigenous              Imported*               Total              Meningococcal             Mumps
                        Disease                                                                                                         Infections
                    ----------------        ---------------       ---------------        ---------------       ---------------        ---------------       ---------------
Reporting Area       Cum.       Cum.        Cum.       Cum.                  Cum.                   Cum.       Cum.       Cum.        Cum.       Cum.       Cum.       Cum.
                     1995       1994        1995       1994       1995       1995        1995       1995       1995       1994        1995       1994       1995       1994
---------------------------------------------------------------------------------------------------------------------------------------------------------------------------
UNITED STATES       5,673      8,468         826        757          2        241           -         20        261        847       2,197      2,005        587      1,042

NEW ENGLAND         1,494      2,090          38         55          -          6           -          1          7         27         101         92         10         17
Maine                  16         17           5          4          -          -           -          -          -          5           7         18          4          3
N.H.                   18         17           3          3          -          -           -          -          -          1          19          8          1          4
Vt.                     8         12           1          3          -          -           -          -          -          3           6          2          -          -
Mass.                 128        135          11         27          -          1           -          1          2          7          37         41          2          2
R.I.                  251        307           4          5          -          5           -          -          5          7           -          -          1          2
Conn.               1,073      1,602          14         13          -          -           -          -          -          4          32         23          2          6

MID. ATLANTIC       3,399      4,984         209        147          -          6           -          4         10        212         260        213         84         87
Upstate N.Y.        1,849      3,180          48         41          -          1           -          -          1         17          80         68         24         26
N.Y. City             139         12         107         51          -          2           -          3          5         14          34         26         13          4
N.J.                  618      1,031          38         33          -          3           -          1          4        173          73         47          6         13
Pa.                   793        761          16         22          -          -           -          -          -          8          73         72         41         44

E.N. CENTRAL           61        455          79         79          -          7           -          3         10        102         292        295        101        170
Ohio                   42         31           9          9          -          1           -          -          1         17          90         84         32         42
Ind.                   11         14          14         11          -          -           -          -          -          1          41         38          3          7
Ill.                    3         23          32         38          -          -           -          2          2         56          71         97         31         80
Mich.                   5          5          13         18          -          4           -          1          5         25          56         45         35         33
Wis.                    -        382          11          3          -          2           -          -          2          3          34         31          -          8

W.N. CENTRAL           99        155          17         32          -          2           -          -          2        170         146        130         38         53
Minn.                  42         58           3         10          -          -           -          -          -          -          24         12          2          4
Iowa                    8         13           1          4          -          -           -          -          -          7          26         16          9         12
Mo.                    30         73           6         11          -          1           -          -          1        160          58         64         22         33
N. Dak.                 -          -           1          1          -          -           -          -          -          -           1          1          1          3
S. Dak.                 -          -           1          -          -          -           -          -          -          -           5          8          -          -
Nebr.                   1          3           3          4          -          -           -          -          -          2          12          9          4          1
Kans.                  18          8           2          2          -          1           -          -          1          1          20         20          -          -

S. ATLANTIC           417        589         176        148          -         10           -          1         11         54         400        296         87        152
Del.                    7         79           1          3          -          -           -          -          -          -           6          5          -          -
Md.                   267        190          45         51          -          -           -          1          1          4          28         26         20         43
D.C.                    1          6          15         12          -          -           -          -          -          -           3          4          -          -
Va.                    40        113          38         20          -          -           -          -          -          2          48         53         19         35
W. Va.                 21         15           2          -          -          -           -          -          -         37           8         11          -          3
N.C.                   44         64          15          9          -          -           -          -          -          3          64         42         16         35
S.C.                   14          7           1          4          -          -           -          -          -          -          52         19          9          7
Ga.                    12        103          22         25          -          2           -          -          2          2          80         65          8          8
Fla.                   11         12          37         24          -          8           -          -          8          6         111         71         15         21

E.S. CENTRAL           35         37          19         29          -          -           -          -          -         28         137        145         13         18
Ky.                     5         21           1         10          -          -           -          -          -          -          46         33          -          -
Tenn.                  20         10           7          9          -          -           -          -          -         28          37         26          -          6
Ala.                    7          6           8          9          -          -           -          -          -          -          29         56          4          5
Miss.                   3          -           3          1          -          -           -          -          -          -          25         30          9          7

W.S. CENTRAL           82         89          38         36          -         21           -          2         23         16         275        237         36        183
Ark.                    5          8           3          3          -          2           -          -          2          1          22         37          3          5
La.                     3          1           4          6          -         17           -          1         18          1          39         31          9         22
Okla.                  36         50           1          4          U          -           U          -          -          -          26         24          -         23
Tex.                   38         30          30         23          -          2           -          1          3         14         188        145         24        133

MOUNTAIN                7         11          42         25          -         67           -          1         68        163         155        136         23        129
Mont.                   -          -           3          -          -          -           -          -          -          -           2          6          1          -
Idaho                   -          3           1          2          -          -           -          -          -          -           7         15          2          7
Wyo.                    3          3           -          1          -          -           -          -          -          -           7          5          -          2
Colo.                   -          1          18         11          -         26           -          -         26         19          40         25          1          3
N. Mex.                 1          2           4          3          -         30           -          1         31          -          31         13          N          N
Ariz.                   -          -           7          2          -         10           -          -         10          1          48         47          2         91
Utah                    1          1           5          4          -          -           -          -          -        134          13         18         11         14
Nev.                    2          1           4          2          -          1           -          -          1          9           7          7          6         12

PACIFIC                79         58         208        206          2        122           -          8        130         75         431        461        195        233
Wash.                   8          1          16         22          -         16           -          4         20          3          72         71         10         14
Oreg.                   4          6           9         12          -          1           -          -          1          2          67        101          N          N
Calif.                 67         51         171        159          2        105           -          3        108         61         281        282        167        200
Alaska                  -          -           2          1          -          -           -          -          -          5           7          2         13          3
Hawaii                  -          -          10         12          -          -           -          1          1          4           4          5          5         16

Guam                    -          -           -          -          U          -           U          -          -        228           3          -          3          6
P.R.                    -          -           1          4          -         11           -          -         11         11          14          6          -          2
V.I.                    -          -           -          -          U          -           U          -          -          -           -          -          2          3
Amer. Samoa             -          -           -          -          -          -           -          -          -          -           -          -          -          2
C.N.M.I.                -          -           1          1          U          -           U          -          -         29           -          -          -          2
---------------------------------------------------------------------------------------------------------------------------------------------------------------------------
*For imported measles, cases include only those resulting from importation from other countries.

N: Not notifiable    U: Unavailable     -: no reported cases

=============================================================================================================================================================================

TABLE II. (page 3) Cases of selected notifiable diseases, United States, weeks
ending September 16, 1995, and September 17, 1994 (37th Week)

                             Pertussis                          Rubella                    Syphilis            Tuberculosis               Rabies,
                                                                                          (Primary &                                      Animal
                                                                                          Secondary)
                     ---------------------------       --------------------------      -----------------     -----------------       ----------------
Reporting Area                  Cum.        Cum.                  Cum.       Cum.        Cum.       Cum.       Cum.       Cum.        Cum.       Cum.
                     1995       1995        1994       1995       1995       1994        1995       1994       1995       1994        1995       1994
-----------------------------------------------------------------------------------------------------------------------------------------------------
UNITED STATES         163      2,629       2,651          -        114        206      10,585     15,235     13,730     15,470       5,043      5,427

NEW ENGLAND             3        322         277          -         34        128         127        164        357        356       1,125      1,348
Maine                   1         25          12          -          1          -           2          4         12         21          22          -
N.H.                    -         25          55          -          1          -           1          4          9         13         113        116
Vt.                     -         49          33          -          -          -           -          -          3          6         135        102
Mass.                   2        209         150          -          7        124          46         69        200        180         339        508
R.I.                    -          2           5          -          -          2           3         12         35         35         247         40
Conn.                   -         12          22          -         25          2          75         75         98        101         269        582

MID. ATLANTIC          13        214         415          -         11          6         613      1,003      2,833      3,150         961      1,430
Upstate N.Y.            3        110         180          -          4          5          43        129        327        397         374      1,057
N.Y. City               -         21          81          -          7          -         287        447      1,527      1,835           -          -
N.J.                    -          5          12          -          -          1         126        155        532        541         260        204
Pa.                    10         78         142          -          -          -         157        272        447        377         327        169

E.N. CENTRAL           11        253         409          -          4          9       1,845      2,276      1,386      1,465          63         49
Ohio                    7        103         106          -          -          -         629        897        197        243          10          4
Ind.                    3         18          47          -          -          -         194        181        173        127          10         12
Ill.                    1         62          87          -          1          1         690        750        679        730           3         15
Mich.                   -         58          41          -          3          8         203        210        283        322          33         10
Wis.                    -         12         128          -          -          -         129        238         54         43           7          8

W.N. CENTRAL           38        173         123          -          -          2         548        898        424        391         227        160
Minn.                  37         80          51          -          -          -          28         36         98         95           9         14
Iowa                    -          7           9          -          -          -          36         45         48         42          89         67
Mo.                     -         40          33          -          -          2         466        764        163        167          19         16
N. Dak.                 -          8           4          -          -          -           -          1          3          7          23         10
S. Dak.                 -         10           8          -          -          -           -          1         15         17          49         26
Nebr.                   -          7           8          -          -          -           9         11         20         16           5          -
Kans.                   1         21          10          -          -          -           9         40         77         47          33         27

S. ATLANTIC             8        236         253          -         26         15       2,706      3,903      2,379      2,786       1,562      1,465
Del.                    -          9           2          -          -          -          10         21         12         29          74         42
Md.                     -         18          58          -          -          -         137        212        241        229         265        412
D.C.                    1          5           5          -          -          -          77        162         71         92          11          2
Va.                     -         15          29          -          -          -         443        563        167        212         295        286
W. Va.                  -          -           4          -          -          -           9          8         54         60          87         58
N.C.                    -         84          58          -          1          -         815      1,212        317        352         352        124
S.C.                    -         20          12          -          1          -         438        574        227        265          98        135
Ga.                     -         22          24          -          1          2         511        592        323        517         195        281
Fla.                    7         63          61          -         23         13         266        559        967      1,030         185        125

E.S. CENTRAL            -        250         117          -          -          -       2,739      2,743      1,046      1,059         209        144
Ky.                     -         11          58          -          -          -         147        148        208        232          22         16
Tenn.                   -        203          18          -          -          -         633        756        294        347          69         34
Ala.                    -         34          29          -          -          -         473        497        296        295         111         90
Miss.                   -          2          12          N          N          N       1,486      1,342        248        185           7          4

W.S. CENTRAL           12        221         108          -          7         12       1,395      3,358      1,726      1,981         527        470
Ark.                    -         28          21          -          -          -          82        370        113        193          21         23
La.                     1         12          10          -          -          -         743      1,288          6         11          25         55
Okla.                   U         24          22          U          -          4          54        114        146        179          31         28
Tex.                   11        157          55          -          7          8         516      1,586      1,461      1,598         450        364

MOUNTAIN                2        400         367          -          4          5         194        200        441        390         127        114
Mont.                   -          3           4          -          -          -           4          2         10          9          38         14
Idaho                   1         80          42          -          -          -           -          1         11         11           1          3
Wyo.                    -          1           -          -          -          -           4          -          1          7          22         16
Colo.                   1         68         180          -          -          -          92        102         37         48           9          9
N. Mex.                 -         78          20          -          -          -          32         18         60         43           5          6
Ariz.                   -        147          96          -          3          -          30         39        224        146          35         49
Utah                    -         18          23          -          1          4           4         10         19         34          11         10
Nev.                    -          5           2          -          -          1          28         28         79         92           6          7

PACIFIC                76        560         582          -         28         29         418        690      3,138      3,892         242        247
Wash.                  57        175          85          -          2          -          11         28        181        195           5         15
Oreg.                   -         26          85          -          1          4           6         29         25         90           -          9
Calif.                 19        319         397          -         22         21         400        627      2,762      3,377         233        192
Alaska                  -          -           -          -          -          -           1          3         53         49           4         31
Hawaii                  -         40          15          -          3          4           -          3        117        181           -          -

Guam                    U          -           2          U          -          1           3          3         33         62           -          -
P.R.                    -          6           2          -          -          -         193        230        123        150          27         64
V.I.                    U          -           -          U          -          -           2         24          -          -           -          -
Amer. Samoa             -          -           1          -          -          -           -          1          3          4           -          -
C.N.M.I.                U          -           -          U          -          -           4          1         13         25           -          -
-----------------------------------------------------------------------------------------------------------------------------------------------------
U: Unavailable   -: no reported cases

=============================================================================================================================================================================

Return to top.

Table_III
Note: To print large tables and graphs users may have to change their printer settings to landscape and use a small font size.

TABLE III. Deaths in 121 U.S. cities* week ending
September 16, 1995 (37th Week)
========================================================================================================
                                           All Causes, By Age (Years)
                        ------------------------------------------------------------      P&I**
Reporting Area          All Ages      >=65      45-64     25-44       1-24        <1      Total
-----------------------------------------------------------------------------------------------
NEW ENGLAND                  527       373         85        50         14         5         31
Boston, Mass.                134        93         22        11          6         2          1
Bridgeport, Conn.             35        19          9         7          -         -          -
Cambridge, Mass.               9         6          3         -          -         -          1
Fall River, Mass.             23        18          4         -          1         -          2
Hartford, Conn.               57        38          7         9          2         1          -
Lowell, Mass.                 24        14          6         4          -         -          -
Lynn, Mass.                   10         6          2         2          -         -          -
New Bedford, Mass.            24        18          4         2          -         -          2
New Haven, Conn.              28        20          6         2          -         -          2
Providence, R.I.              56        46          5         3          -         2          8
Somerville, Mass.              5         5          -         -          -         -          -
Springfield, Mass.            49        37          6         4          2         -          8
Waterbury, Conn.              24        18          4         1          1         -          -
Worcester, Mass.              49        35          7         5          2         -          7

MID. ATLANTIC              2,276     1,423        479       290         51        31         94
Albany, N.Y.                  40        28          9         3          -         -          2
Allentown, Pa.                15        11          4         -          -         -          2
Buffalo, N.Y.                100        75         10         8          5         2          4
Camden, N.J.                  38        18          7        10          2         1          1
Elizabeth, N.J.               19        14          2         3          -         -          -
Erie, Pa.***                  42        32          9         -          1         -          1
Jersey City, N.J.             39        23         10         6          -         -          -
New York City, N.Y.        1,264       751        284       184         28        17         32
Newark, N.J.                  47        20         13        11          2         1          3
Paterson, N.J.                32        15          5         9          1         -          1
Philadelphia, Pa.            194       110         56        20          6         2         11
Pittsburgh, Pa.***            56        43          6         4          1         2          3
Reading, Pa.                  20        17          3         -          -         -          2
Rochester, N.Y.              107        74         24         7          1         1         15
Schenectady, N.Y.             20        17          2         -          -         1          2
Scranton, Pa.***              29        23          5         1          -         -          2
Syracuse, N.Y.               130        98         16         9          3         4         13
Trenton, N.J.                 33        14         10         8          1         -          -
Utica, N.Y.                   21        18          1         2          -         -          -
Yonkers, N.Y.                 30        22          3         5          -         -          -

E.N. CENTRAL               2,122     1,355        421       193         65        58        149
Akron, Ohio                   56        41          9         3          1         2          -
Canton, Ohio                  31        27          4         -          -         -          4
Chicago, Ill.                358       190         88        48         16        15         27
Cincinnati, Ohio             135        62         25        15          3         1          5
Cleveland, Ohio              155        87         38        20          4         6          1
Columbus, Ohio               170       105         37        13          8         7         11
Dayton, Ohio                 116        78         23        11          3         1          8
Detroit, Mich.               196       110         39        32          9         6          5
Evansville, Ind.              50        40          5         2          1         2          1
Fort Wayne, Ind.              64        43         15         6          -         -          5
Gary, Ind.                     U         U          U         U          U         U          U
Grand Rapids, Mich.           64        46          9         2          2         5         12
Indianapolis, Ind.           168       110         36        13          4         5         15
Madison, Wis.                106        77         20         5          2         2         13
Milwaukee, Wis.              136        94         27        10          4         1         16
Peoria, Ill.                  40        36          1         1          1         1          4
Rockford, Ill.                51        34         10         4          2         1          2
South Bend, Ind.              46        35          7         2          1         1          7
Toledo, Ohio                 102        79         17         2          2         2         11
Youngstown, Ohio              78        61         11         4          2         -          2

W.N. CENTRAL                 805       527        148        72         27        20         42
Des Moines, Iowa             112        84         16         8          2         2          7
Duluth, Minn.                 33        26          3         4          -         -          2
Kansas City, Kans.            35        17          8         8          2         -          -
Kansas City, Mo.              98        57         17        11          2         -          6
Lincoln, Nebr.                35        29          4         2          -         -          1
Minneapolis, Minn.           169       117         29        12          5         6         12
Omaha, Nebr.                  82        49         23         7          1         2          5
St. Louis, Mo.               111        70         27         4          5         5          1
St. Paul, Minn.               46        37          5         1          1         2          5
Wichita, Kans.                84        41         16        15          9         3          3

S. ATLANTIC                1,533       920        333       194         40        42         82
Atlanta, Ga.                 188        99         46        36          2         5          5
Baltimore, Md.               331       196         75        42         10         8         25
Charlotte, N.C.              123        87         22        12          1         1          7
Jacksonville, Fla.           144        96         26        14          2         6          6
Miami, Fla.                  106        44         33        23          4         1          -
Norfolk, Va.                  55        25         16         6          2         6          2
Richmond, Va.                 87        56         15         8          5         3          3
Savannah, Ga.                 49        33         12         3          -         1          3
St. Petersburg, Fla.          66        51          9         2          1         3          7
Tampa, Fla.                  213       150         38        16          3         5         20
Washington, D.C.             166        80         41        32         10         3          4
Wilmington, Del.               5         3          -         -          -         -          -

E.S. CENTRAL                 715       446        147        68         30        19         47
Birmingham, Ala.             121        65         30        11          9         6          3
Chattanooga, Tenn.            73        57          6         7          1         2          3
Knoxville, Tenn.              77        50         16         7          3         1          6
Lexington, Ky.                79        48         16         7          2         1          6
Memphis, Tenn.               134        85         26        14          7         2         13
Mobile, Ala.                  39        24         10         2          1         2          2
Montgomery, Ala.              35        20          8         5          1         1          2
Nashville, Tenn.             157        97         35        15          6         4         12

W.S. CENTRAL               1,401       877        284       152         57        30         88
Austin, Tex.                  76        49         18         6          3         -          2
Baton Rouge, La.              40        25         12         3          -         -          1
Corpus Christi, Tex.           U         U          U         U          U         U          U
Dallas, Tex.                 214       121         44        36          8         5          3
El Paso, Tex.                 86        53         17         7          5         3          4
Ft. Worth, Tex.               92        56         19        10          5         2          7
Houston, Tex.                370       230         75        39         19         7         35
Little Rock, Ark.             57        34         17         4          1         1          4
New Orleans, La.              90        50         14        16          7         3          -
San Antonio, Tex.            215       144         36        21          5         9         17
Shreveport, La.               60        44         11         3          2         -          7
Tulsa, Okla.                 101        71         21         7          2         -          8

MOUNTAIN                     904       552        185       118         32        17         49
Albuquerque, N.M.            111        64         28        10          8         1          1
Colo. Springs, Colo.          52        33         12         5          2         -          1
Denver, Colo.                129        77         22        22          5         3         10
Las Vegas, Nev.              171       104         39        24          3         1          7
Ogden, Utah                   16        15          -         -          -         1          1
Phoenix, Ariz.               156        90         29        31          2         4         11
Pueblo, Colo.                 31        22          5         3          1         -          2
Salt Lake City, Utah          96        56         22         8          6         4          6
Tucson, Ariz.                142        91         28        15          5         3         10

PACIFIC                    1,633     1,095        283       165         59        28        110
Berkeley, Calif.              21        14          5         2          -         -          2
Fresno, Calif.                78        55         12         5          5         1          6
Glendale, Calif.              24        18          2         2          1         1          1
Honolulu, Hawaii              73        52         14         2          1         4         11
Long Beach, Calif.            57        34         14         6          1         2         10
Los Angeles, Calif.          517       325         92        65         30         2         27
Pasadena, Calif.              21        18          2         1          -         -          2
Portland, Oreg.              134        96         22         9          6         1          7
Sacramento, Calif.             U         U          U         U          U         U          U
San Diego, Calif.            159       101         28        21          5         4         11
San Francisco, Calif.          U         U          U         U          U         U          U
San Jose, Calif.             227       166         33        18          5         5         12
Santa Cruz, Calif.            44        36          5         2          -         1          7
Seattle, Wash.               142        90         25        22          2         3          6
Spokane, Wash.                59        40         15         1          1         2          4
Tacoma, Wash.                 77        50         14         9          2         2          4

TOTAL                   11,916****   7,568      2,365     1,302        375       250        692
-----------------------------------------------------------------------------------------------
   * Mortality data in this table are voluntarily reported from 121 cities in the United States,
     most of which have populations of 100,000 or more. A death is reported by the place of its
     occurrence and by the week that the death certificate was filed. Fetal deaths are not included.
  ** Pneumonia and influenza.
 *** Because of changes in reporting methods in these 3 Pennsylvania cities, these numbers are partial
     counts for the current week. Complete counts will be available in 4 to 6 weeks.
**** Total includes unknown ages.

U: Unavailable    -: no reported cases
========================================================================================================

Return to top.

Disclaimer   All MMWR HTML versions of articles are electronic conversions from ASCII text into HTML. This conversion may have resulted in character translation or format errors in the HTML version. Users should not rely on this HTML document, but are referred to the electronic PDF version and/or the original MMWR paper copy for the official text, figures, and tables. An original paper copy of this issue can be obtained from the Superintendent of Documents, U.S. Government Printing Office (GPO), Washington, DC 20402-9371; telephone: (202) 512-1800. Contact GPO for current prices.

**Questions or messages regarding errors in formatting should be addressed to mmwrq@cdc.gov.

Page converted: 09/19/98

HOME  |  ABOUT MMWR  |  MMWR SEARCH  |  DOWNLOADS  |  RSSCONTACT
POLICY  |  DISCLAIMER  |  ACCESSIBILITY

Safer, Healthier People

Morbidity and Mortality Weekly Report
Centers for Disease Control and Prevention
1600 Clifton Rd, MailStop E-90, Atlanta, GA 30333, U.S.A

USA.GovDHHS

Department of Health
and Human Services

This page last reviewed 5/2/01