| US Imports of Steel Mill Products | |||
| FROM JAPAN |
|||
| Quantity in Metric Tons | |||
| Same Table - US Dollars |
Same Table - Average Unit Value |
||
| 'C & A' = Carbon and Alloy products, 'S' = Stainless products | |||
| Graph | Product | Census Data | Preliminary Census Data |
License Data | |||||||||||||
|---|---|---|---|---|---|---|---|---|---|---|---|---|---|---|---|---|---|
| JUL07 | AUG07 | SEP07 | OCT07 | NOV07 | DEC07 | JAN08 | FEB08 | MAR08 | APR08 | MAY08 | JUN08 | JUL08 | AUG08 | AUG08 | SEP08 | ||
| All Steel Mill Products | |||||||||||||||||
| M | All Steel Mill Products | 141,249 | 177,349 | 86,063 | 99,617 | 96,965 | 80,030 | 149,157 | 80,494 | 131,203 | 190,525 | 107,959 | 113,818 | 172,459 | 156,682 | 138,134 | 119,552 |
| Carbon and Alloy Products | |||||||||||||||||
| M | All Carbon and Alloy Products | 137,431 | 170,587 | 81,987 | 93,566 | 90,128 | 74,228 | 143,627 | 75,283 | 126,847 | 185,181 | 101,986 | 108,816 | 165,549 | 150,006 | 131,575 | 114,491 |
| M | Long Products -- C & A | 82,707 | 73,326 | 51,237 | 37,565 | 51,958 | 32,579 | 55,655 | 45,486 | 81,138 | 89,904 | 52,399 | 61,396 | 74,790 | 79,053 | 66,877 | 51,969 |
| M | Flat Products -- C & A | 19,251 | 34,878 | 23,021 | 22,335 | 19,992 | 20,052 | 26,606 | 20,284 | 22,551 | 35,541 | 20,026 | 23,732 | 27,906 | 34,882 | 34,710 | 22,995 |
| M | Pipe and Tube -- C & A | 24,830 | 26,147 | 7,531 | 33,130 | 18,178 | 21,237 | 24,317 | 9,261 | 22,763 | 22,468 | 28,656 | 22,484 | 27,686 | 34,551 | 28,594 | 36,208 |
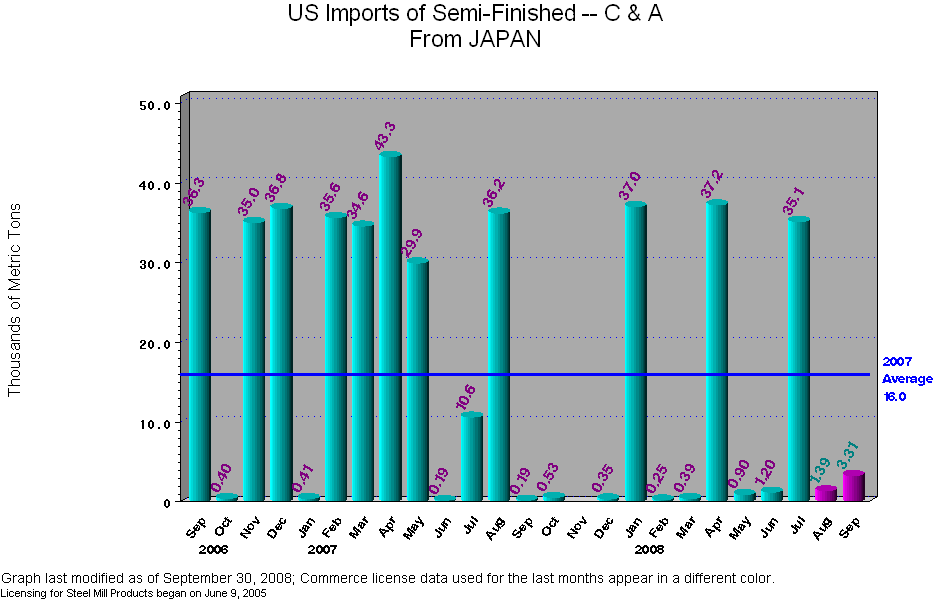
| M | Semi-Finished -- C & A | 10,641 | 36,235 | 196.7 | 534.8 | . | 358.5 | 37,047 | 251.2 | 393.5 | 37,268 | 903.5 | 1,202 | 35,165 | 1,520 | 1,392 | 3,317 |
| Stainless Products | |||||||||||||||||
| M | All Stainless Products | 3,818 | 6,761 | 4,075 | 6,051 | 6,837 | 5,801 | 5,530 | 5,210 | 4,356 | 5,343 | 5,972 | 5,002 | 6,909 | 6,676 | 6,558 | 5,060 |
| M | Pipe and Tube -- S | 1,844 | 4,418 | 1,861 | 4,168 | 3,349 | 2,855 | 3,328 | 2,526 | 1,929 | 2,493 | 2,894 | 2,421 | 4,204 | 4,242 | 4,141 | 2,922 |
| M | Flat Products -- S | 1,860 | 2,196 | 2,004 | 1,760 | 3,263 | 2,715 | 1,969 | 2,355 | 2,216 | 2,479 | 2,635 | 2,208 | 2,446 | 2,215 | 2,219 | 1,846 |
| M | Long Products -- S | 77.1 | 144.0 | 193.7 | 121.1 | 215.5 | 224.9 | 224.8 | 325.8 | 206.1 | 370.0 | 436.2 | 368.4 | 256.4 | 217.2 | 197.5 | 289.2 |
| M | Semi-Finished -- S | 36.7 | 3.24 | 14.9 | 1.51 | 8.34 | 5.77 | 6.90 | 2.25 | 3.48 | . | 6.53 | 3.95 | 1.86 | . | . | 1.75 |
| SOURCE: US Department of Commerce, Import Administration |
| Table last modified on: September 30, 2008, with |
| Licensing data collected through September 30, 2008 and |
| Preliminary Census data compiled through August 2008 |
| Data listed in order of descending volume imported during last THREE months of Census data, including peliminary data |
| Steel mill categories are defined by 10-digit HTS codes |
| To see License Data at HTS 6-digit level click on chart title at the top of the page. |
| Link to Annual Summary of Census Data |