| US Imports of Steel Mill Products | |||
| FOR Bars-Cold Finished -- C & A |
|||
| Average Unit Value in US$ per Metric Ton | |||
| Same Table - Metric Tons |
Same Table - US Dollars |
||
| 'C & A' = Carbon and Alloy products, 'S' = Stainless products | |||
| Graph | Country | Census Data | Preliminary Census Data |
License Data | |||||||||||||
|---|---|---|---|---|---|---|---|---|---|---|---|---|---|---|---|---|---|
| JUL07 | AUG07 | SEP07 | OCT07 | NOV07 | DEC07 | JAN08 | FEB08 | MAR08 | APR08 | MAY08 | JUN08 | JUL08 | AUG08 | AUG08 | SEP08 | ||
| M | WORLD | $1,466 | $1,369 | $1,628 | $1,481 | $1,372 | $1,650 | $1,536 | $1,578 | $1,546 | $1,434 | $1,642 | $1,848 | $1,876 | $1,988 | $2,003 | $2,087 |
| M | CANADA | $1,499 | $1,347 | $1,588 | $1,544 | $1,580 | $1,584 | $1,623 | $1,606 | $1,589 | $1,636 | $1,675 | $1,841 | $2,086 | $2,175 | $2,232 | $2,552 |
| M | GERMANY | $1,249 | $1,311 | $1,286 | $1,265 | $1,324 | $1,491 | $1,230 | $1,344 | $1,333 | $1,531 | $1,723 | $1,925 | $1,934 | $2,020 | $2,022 | $2,064 |
| M | FRANCE | $1,752 | $1,804 | $1,954 | $1,929 | $1,831 | $1,828 | $1,743 | $1,819 | $2,012 | $1,982 | $2,127 | $1,980 | $1,966 | $2,052 | $1,886 | $2,245 |
| M | SPAIN | $1,035 | $1,061 | $1,174 | $1,035 | $1,091 | $1,129 | $1,387 | $1,059 | $1,258 | $1,337 | $1,414 | $1,595 | $1,443 | $1,632 | $1,661 | $1,988 |
| M | UNITED KINGDOM | $2,000 | $2,401 | $2,458 | $2,780 | $2,434 | $2,366 | $2,413 | $2,209 | $2,188 | $2,311 | $2,020 | $2,513 | $2,466 | $2,455 | $2,686 | $2,503 |
| M | CHINA | $782 | $1,085 | $1,375 | $1,800 | $1,090 | $1,588 | $1,451 | $1,737 | $1,266 | $1,155 | $1,153 | $1,597 | $1,303 | $1,448 | $1,390 | $1,803 |
| M | JAPAN | $1,251 | $1,093 | $1,166 | $1,224 | $1,264 | $1,542 | $1,257 | $1,181 | $1,099 | $1,244 | $1,280 | $1,300 | $1,323 | $1,227 | $1,343 | $1,554 |
| M | RUSSIA | . | $959 | . | $894 | $814 | . | . | $2,171 | . | $1,072 | $882 | . | $857 | . | $3,788 | $1,226 |
| M | ITALY | $1,379 | $1,367 | $1,377 | $1,492 | $2,103 | $1,534 | $1,451 | $1,469 | $1,457 | $1,753 | $1,607 | $1,704 | $2,272 | $1,843 | $1,781 | $2,190 |
| M | KOREA | $1,357 | $1,802 | $1,255 | $1,290 | $1,309 | $1,507 | $1,495 | $1,357 | $1,153 | $1,594 | $1,122 | $1,793 | $1,787 | $1,756 | $1,791 | $1,525 |
| M | UKRAINE | $1,077 | $1,030 | $3,100 | $1,157 | $1,504 | $3,662 | $1,442 | . | . | $3,626 | . | . | $1,750 | . | . | . |
| M | MEXICO | $1,450 | $1,234 | $1,763 | $1,417 | $1,490 | $1,465 | $1,114 | $1,457 | $2,435 | $1,477 | $1,986 | $935 | $1,144 | $1,183 | $1,229 | $602 |
| M | SOUTH AFRICA | $771 | $811 | $714 | $732 | $844 | $810 | $780 | . | $952 | $884 | . | $1,017 | $1,077 | . | $1,985 | $1,343 |
| M | SWEDEN | $3,391 | $6,635 | $2,159 | $2,373 | $2,038 | $2,488 | $2,760 | $1,972 | $3,151 | $2,127 | $2,567 | $3,133 | $3,323 | $2,454 | $2,584 | . |
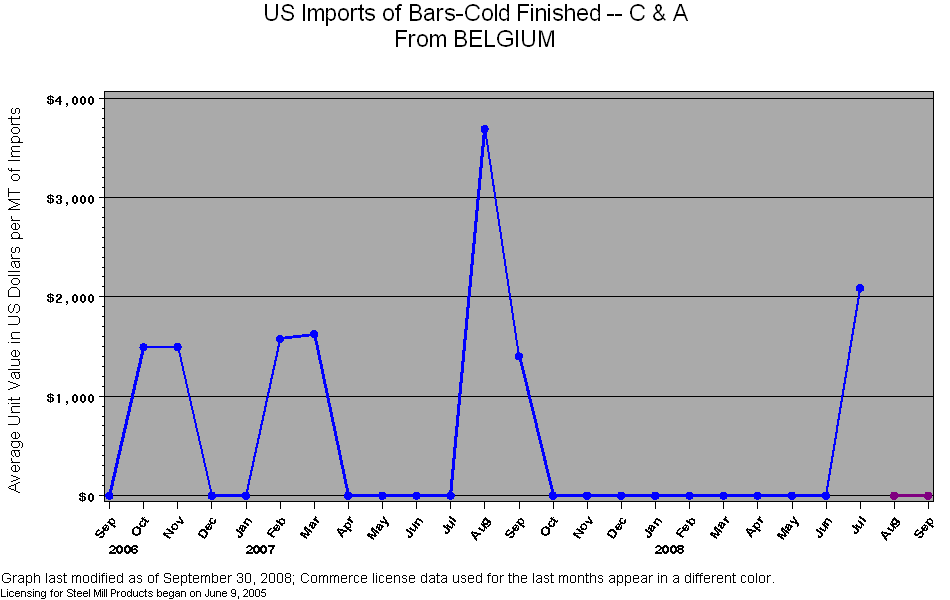
| M | BELGIUM | . | $3,691 | $1,403 | . | . | . | . | . | . | . | . | . | $2,089 | $1,706 | . | . |
| M | TAIWAN | $2,088 | $2,346 | $2,148 | $2,546 | $2,230 | $2,507 | $3,775 | $2,630 | $1,289 | $2,855 | $2,864 | $2,801 | $2,702 | $3,160 | $3,097 | $6,222 |
| M | INDIA | $3,326 | $10,699 | $10,323 | $9,776 | $8,174 | $4,517 | $10,398 | $10,522 | $12,958 | $12,064 | $11,309 | $8,954 | $8,453 | $4,148 | $4,169 | $6,619 |
| M | ROMANIA | . | $2,457 | $2,900 | . | $3,517 | $3,285 | $3,816 | $2,992 | $5,501 | . | $6,272 | . | $6,609 | $3,464 | $3,652 | $4,250 |
| M | SWITZERLAND | $1,555 | . | $1,875 | $3,145 | . | $3,042 | $33,773 | $1,843 | . | . | $2,029 | $2,688 | $3,442 | . | $13,060 | $3,156 |
| M | CZECH REPUBLIC | $1,766 | $2,516 | . | . | . | $2,056 | . | . | $3,858 | . | . | . | . | $4,976 | $4,976 | . |
| M | DOMINICAN REPUBLIC | . | . | . | $22,975 | . | . | . | $620 | . | $671 | . | . | $620 | $620 | $494,836 | $160,861 |
| M | AUSTRIA | $2,242 | $2,764 | $3,403 | . | $2,797 | $2,280 | $15,565 | . | $38,799 | $2,280 | $2,280 | $3,059 | $3,342 | . | $10,000 | $3,019 |
| M | BRAZIL | $3,614 | $8,088 | $2,353 | $2,569 | $5,945 | $2,280 | $2,280 | $8,916 | $3,495 | $2,750 | . | . | $3,507 | . | $2,850 | . |
| M | AUSTRALIA | . | . | . | . | . | . | . | . | . | $600 | . | . | . | . | . | . |
| M | DENMARK | . | . | . | . | . | . | . | . | . | . | . | . | . | . | . | $38,497 |
| M | ISRAEL | . | . | . | . | . | . | . | . | . | . | . | . | . | . | $55,105 | $50,650 |
| M | MALAYSIA | $749 | $1,420 | $728 | . | $735 | . | . | $779 | . | . | $842 | . | . | . | . | . |
| M | NETHERLANDS | . | . | . | $3,506 | . | . | $2,264 | . | . | . | . | . | . | . | $19,750 | $36,864 |
| M | SLOVENIA | . | . | . | $4,152 | . | . | . | . | . | . | . | . | . | . | . | . |
| M | UNITED STATES | . | . | . | . | . | . | . | . | . | . | . | . | . | . | $1,780 | $1,849 |
| SOURCE: US Department of Commerce, Import Administration |
| Table last modified on: September 30, 2008, with |
| Licensing data collected through September 30, 2008 and |
| Preliminary Census data compiled through August 2008 |
| Data listed in order of descending volume imported during last THREE months of Census data, including peliminary data |
| Steel mill categories are defined by 10-digit HTS codes |
| To see License Data at HTS 6-digit level click on chart title at the top of the page. |
| Link to Annual Summary of Census Data |
| Link to Summary Level of Monthly Census Data |