Otto was a tropical storm that originated from a mid-latitude baroclinic system. The cyclone remained over the open Atlantic Ocean about midway between Bermuda and the Azores Islands.
A cold front emerged off the east coast of the United States on 21 November and moved slowly eastward before stalling about midway between Bermuda and the Azores Islands early on 25 November. Later that day, a strong upper-level trough to the north dug southward and initiated the development of an extratropical low along the front about 1000 n mi southwest of the Azores Islands by 0000 UTC 26 November. Due to the strong baroclinic effects of the upper-low, the occluded surface low pressure system quickly deepened and became a large gale area later that day. The upper-level trough continued to dig southward and eventually developed a cutoff low to the south of the occluded surface low on 26 November.
The surface and upper-level lows moved generally southwestward at 5-10 kt in tandem for the next three days. Late on 28 November, weak ridging to the north of the upper-low formed over the surface low and convective banding features began to develop near the low-level center. In addition, surface data and analyses from the Tropical Prediction Center's Tropical Analysis and Forecast Branch (TAFB) indicated that the frontal structure associated with the cyclone had dissipated. Dvorak satellite classifications from the various satellite agencies at that time suggest that Subtropical Storm Otto formed about 1000 n mi east-southeast of Bermuda around 1200 UTC 29 November. The "best track" chart of the cyclone's path is given in Figure 1, while the best track positions and intensities are listed in Table 1. Wind and pressure plots are shown in Figure 2 and Figure 3, respectively.
After Otto acquired subtropical characteristics, the cyclone moved northwestward through a weakness in the mid-level subtropical ridge located to its north. Convection continued to increase over the low-level center and Advanced Microwave Sounding Unit (AMSU) satellite-derived temperature data indicate the system acquired enough warm-core characteristics to be considered a tropical storm at 1200 UTC 30 November about 700 n mi east of Bermuda. For the next 2 days, the cyclone meandered over relatively cool water (sea-surface temperatures of 21-23° C) and beneath a region of relatively weak vertical shear between the upper-low located to its south and another weaker upper-low situated to its northeast. The marginally favorable upper-level flow pattern allowed Otto to maintain some central deep convection. The tropical storm turned slowly southeastward on 1 December as north to northwesterly mid- to upper-level flow increased on the east side of an amplifying ridge off the U.S. east coast. However, the vertical shear also increased causing the deep convection to become displaced to the southeast of the center, which induced a slow weakening trend. Otto weakened into a tropical depression on 2 December. Mid-level dry air entrainment, coupled with the increasing vertical shear, eventually eroded the convection and Otto degenerated into a non-convective remnant low pressure system on 3 December about 800 n mi southeast of Bermuda. For the next 2 days, the broad remnant drifted slowly southward and southwestward before dissipating around 1200 UTC 5 December about 800 n mi northeast of the northern Leeward Islands.
Observations in Otto (Figure 2 and Figure 3) include satellite-based Dvorak technique intensity estimates from the Tropical Analysis and Forecast Branch (TAFB), the Satellite Analysis Branch (SAB), and the U. S. Air Force Weather Agency (AFWA), as well as microwave satellite imagery from NOAA polar-orbiting satellites, the NASA Tropical Rainfall Measuring Mission (TRMM), the NASA QuikSCAT, and Defense Meteorological Satellite Program (DMSP) satellites.
Ship reports of tropical storm force winds associated with Otto are given in Table 2.
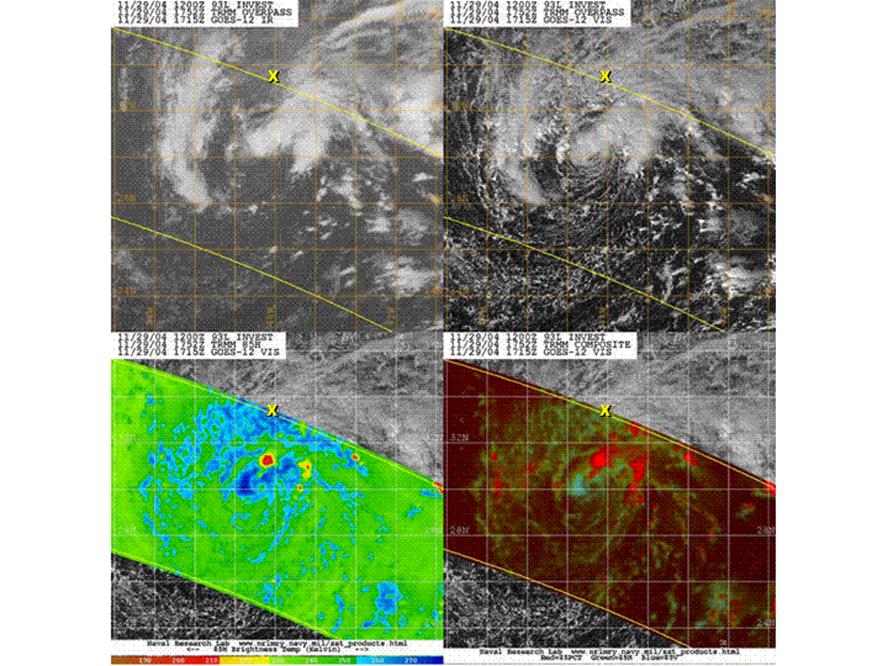
Otto's peak intensity of 45 kt during the subtropical storm stage (Figure 4) is based on a blend of ship reports and Dvorak satellite intensity estimates. Ship LAXP4 (Star Hansa) reported a sustained wind of 51 kt at 1800 UTC 29 November about 190 n mi northeast of the center. However, quality control checks by the NOAA Ocean Prediction Center indicate that the wind speeds had a slight high bias. In addition, Ship V7BI3 (Sabine) reported a sustained wind of 52 kt at 0900 UTC and 51 kt at 0600 UTC 1 December about 200 n mi northwest of the center. Quality control checks revealed that those reports had a severe high bias, and were also considerably higher than the 30- to 35-kt wind reports from nearby ships. Therefore, the wind reports from ship V7BI3 were not used in determining the 'best track' intensity estimates, nor were they included in Table 2. It is also interesting to note that during Otto's weakening period, several normally reliable Objective Dvorak (ODT) satellite intensity estimates (Figure =2) were much higher than nearby ship and QuikSCAT wind data were indicating. This may be due to the relatively shallow nature of Otto (convective cloud top temperatures were rarely observed below -50° C) and its possibly possessing more subtropical than tropical characteristics.
It is difficult to ascertain exactly when an extratropical low acquires enough warm-core characteristics to be classified as a subtropical low, or when a subtropical low becomes a tropical cyclone. Therefore, it is possible that Otto may have become a tropical cyclone earlier on 29 November.
There were no reports of damages or casualties associated with Tropical Storm Otto.
No meaningful forecast verification statistics are available due to Otto's short lifetime. However, the few cases that made up the 12-, 24-, 36-, and 48-h average errors of 34, 71, 103, and 159 n mi, respectively, were better than the 10-yr average of 44, 78, 112, 146 n mi through 36 h. The larger track error at 48 h was due to the first two official forecasts, which called for Otto to move eastward, as suggested by the various NHC consensus models. Average official intensity errors were 3, 3, 5, and 5 kt for the 12, 24, 36, and 48 h forecasts, respectively. These errors were exceptionally good as compared to the average official intensity errors over the 10-yr period 1994-2003 of 6, 10, 12, and 15 kt, respectively.
No tropical cyclone watches or warnings were required for Tropical Storm Otto. However, the NOAA Ocean Prediction Center and the TPC's Tropical Analysis and Forecast Branch issued marine gale warnings for their respective Atlantic High Seas Forecast areas of responsibility about 18 h before the development of the pre-Otto extratropical low.
| Date/Time (UTC) | Position | Pressure (mb) | Wind Speed (kt) | Stage | |
|---|---|---|---|---|---|
| Lat. (°N) | Lon. (°W) |
||||
| 26 / 0000 | 28.0 | 40.0 | 1009 | 30 | extratropical |
| 26 / 0600 | 27.3 | 41.0 | 1006 | 35 | " |
| 26 / 1200 | 26.5 | 41.9 | 1002 | 35 | " |
| 26 / 1800 | 26.8 | 42.5 | 1000 | 35 | " |
| 27 / 0000 | 26.8 | 43.2 | 1000 | 35 | " |
| 27 / 0600 | 26.7 | 43.8 | 1000 | 35 | " |
| 27 / 1200 | 26.4 | 44.3 | 1000 | 35 | " |
| 27 / 1800 | 26.2 | 44.4 | 1000 | 35 | " |
| 28 / 0000 | 26.3 | 44.1 | 1000 | 35 | " |
| 28 / 0600 | 27.4 | 43.9 | 1000 | 35 | " |
| 28 / 1200 | 28.2 | 44.0 | 1000 | 35 | " |
| 28 / 1800 | 28.7 | 45.1 | 999 | 35 | " |
| 29 / 0000 | 28.8 | 46.5 | 998 | 35 | " |
| 29 / 0600 | 29.0 | 47.8 | 998 | 40 | " |
| 29 / 1200 | 29.6 | 47.9 | 998 | 40 | subtropical storm |
| 29 / 1800 | 30.2 | 48.8 | 998 | 45 | " |
| 30 / 0000 | 30.7 | 49.7 | 997 | 45 | " |
| 30 / 0600 | 30.9 | 50.5 | 997 | 45 | " |
| 30 / 1200 | 31.3 | 51.0 | 997 | 40 | tropical storm |
| 30 / 1800 | 31.7 | 51.0 | 997 | 40 | " |
| 01 / 0000 | 31.8 | 50.9 | 997 | 40 | " |
| 01 / 0600 | 31.9 | 50.8 | 997 | 40 | " |
| 01 / 1200 | 31.6 | 50.4 | 997 | 40 | " |
| 01 / 1800 | 31.0 | 50.1 | 997 | 35 | " |
| 02 / 0000 | 30.5 | 49.9 | 997 | 35 | " |
| 02 / 0600 | 29.9 | 50.1 | 996 | 35 | " |
| 02 / 1200 | 29.1 | 50.4 | 995 | 30 | tropical depression |
| 02 / 1800 | 28.5 | 50.1 | 996 | 30 | " |
| 03 / 0000 | 27.9 | 50.1 | 997 | 30 | " |
| 03 / 0600 | 27.2 | 50.2 | 998 | 30 | remnant low |
| 03 / 1200 | 26.5 | 50.3 | 1000 | 30 | " |
| 03 / 1800 | 26.2 | 50.6 | 1002 | 25 | " |
| 04 / 0000 | 25.8 | 50.2 | 1005 | 25 | " |
| 04 / 0600 | 25.4 | 50.1 | 1008 | 25 | " |
| 04 / 1200 | 25.0 | 50.4 | 1010 | 25 | " |
| 04 / 1800 | 25.1 | 50.9 | 1011 | 25 | " |
| 05 / 0000 | 25.5 | 51.1 | 1012 | 20 | " |
| 05 / 0600 | 25.9 | 51.1 | 1013 | 20 | " |
| 05 / 1200 | 26.1 | 51.4 | 1014 | 20 | " |
| 05 / 1800 | dissipated | ||||
| 02 / 1200 | 29.1 | 50.4 | 995 | 30 | minimum pressure |
| Ship Name or Call Sign | Date/Time (UTC) | Lat. (°N) | Lon. (°W) | Wind dir/speed (deg/kt) | Pressure (mb) |
|---|---|---|---|---|---|
| V2OO7 | 26 / 0000 | 33.0 | 41.1 | 070 / 37 | 1015.0 |
| V2OO7 | 26 / 1800 | 33.1 | 37.4 | 070 / 37 | 1017.0 |
| V3WY2 | 28 / 1800 | 32.1 | 44.9 | 070 / 35 | 1011.7 |
| LAXP4 | 29 / 0000 | 32.6 | 51.3 | 060 / 35 | 1014.0 |
| V3WY2 | 29 / 0000 | 31.5 | 46.4 | 070 / 35 | 1006.6 |
| V3WY2 | 29 / 0600 | 31.0 | 48.0 | 070 / 39 | 1005.0 |
| LAXP4 | 29 / 1200 | 33.0 | 48.9 | 060 / 40 | 1010.0 |
| V3WY2 | 29 / 1200 | 30.3 | 49.6 | 070 / 35 | 1001.3 |
| WAUW | 29 / 1200 | 33.5 | 42.8 | 090 / 35 | 1018.0 |
| LAXP4 | 29 / 1800 | 33.5 | 48.1 | 060 / 51 | 1008.8 |
| PCGQ | 29 / 1800 | 35.7 | 50.3 | 070 / 37 | 1014.1 |
| WAUW | 29 / 1800 | 33.3 | 44.7 | 090 / 37 | 1013.5 |
| LAXP4 | 30 / 0000 | 33.8 | 47.8 | 070 / 41 | 1009.2 |
| LAXP4 | 30 / 0600 | 34.4 | 46.7 | 080 / 37 | 1010.2 |
| LAXP4 | 30 / 1200 | 35.1 | 45.7 | 080 / 37 | 1012.2 |
Figure 1: Best track positions for Tropical Storm Otto, 29 November - 3 December 2004.
Figure 2: Selected wind observations and best track maximum sustained surface wind speed curve for Tropical Storm Otto, 29 November - 3 December 2004. Objective Dvorak estimates represent linear averages over a three-hour period centered on the nominal observation time. Surface plots include ship reports and non-rainflagged QuikSCAT wind vector data. Subtropical Dvorak satellite classifications are denoted by a small dot plotted to the left of or below the data symbol.
Figure 3: Selected pressure observations and best track minimum central pressure curve for Tropical Storm Otto, 29 November - 3 December 2004. Objective Dvorak estimates represent linear averages over a three-hour period centered on the nominal observation time. Surface pressure data plots were obtained from ship and buoy observations within 120 n mi of the center.
Figure 4: TRMM microwave satellite image at 1752 UTC 29 November 2004, near Otto's peak intensity of 45 kt as a subtropical storm. The yellow "X" denotes the location of ship LAXP4 at 1800 UTC when it reported a sustained wind of 51 kt. Quality control checks indicate the wind report was about 4-6 kt high (image courtesy of the Naval Research Laboratory, Monterey, CA).
Tropical Cyclone Reports
Alex -
Bonnie -
Charley -
Danielle -
Earl -
Frances -
Gaston -
Hermine -
Ivan -
Ten -
Jeanne -
Karl -
Lisa -
Matthew -
Nicole -
Otto
Get Storm Info
Satellite Imagery -
US Weather Radar -
Aircraft Recon -
Advisory Archive -
Mobile Products -
E-Mail Advisories -
RSS Feeds -
About NHC Products
Tropical Analysis and Forecasting
Atlantic Products -
E Pac Products -
About TAFB Products
Learn About Hurricanes
Hurricane Awareness -
Frequently Asked Questions -
AOML Hurricane-Research Division -
Hurricane Hunters -
The Saffir-Simpson-Hurricane Scale -
Forecasting Models -
Inland Wind Model -
Eyewall Wind-Profiles -
TPC Glossary -
TPC Acronyms -
Storm Names
Breakpoints
Hurricane History
NHC/TPC Archives -
Forecast Verification -
Climatology -
1492-1996 (Atlantic) -
1900-2000 (USA) -
Most Expensive -
Most Intense -
US Strikes by Decade -
US Strikes by State
About Us
About the TPC -
Mission/Vision -
Other NCEP Centers -
TPC Personnel -
NOAA Locator -
Visitor Information -
NHC Library -
WX4NHC Amateur Radio Station
NOAA/
National Weather Service
National Centers for Environmental Prediction
National Hurricane Center
Tropical Prediction Center
11691 SW 17th Street
Miami, Florida, 33165-2149 USA
nhcwebmaster@noaa.gov
Disclaimer
Privacy Policy
Credits
About Us
Glossary
Career Opportunities
Page last modified: Tuesday, 15-Mar-2005 21:06:17 GMT