|
COAL TAR PITCH VOLATILES (CTPV)
COKE OVEN EMISSIONS (COE)
SELECTED POLYNUCLEAR AROMATIC HYDROCARBONS (PAHs)
| Method no.: |
58 |
|
| Matrix: |
Air |
|
| Procedure: |
Air samples are collected by drawing known amounts of air through cassettes containing glass fiber filters (GFF).
The filters are analyzed by extracting with benzene and gravimetrically determining the
benzene-soluble fraction (BSF). If the BSF exceeds the appropriate PEL, then the sample is
analyzed by high performance liquid chromatography (HPLC) with a fluorescence (µL) or
ultraviolet (UV) detector to determine the presence of selected polynuclear aromatic
hydrocarbons (PAHs). |
|
Recommended air volume
and sampling rate: |
960 L at 2.0 L/min |
|
| Special requirements: |
Each GFF must be transferred to a separate scintillation vial after sampling and the vial sealed with a
PTFE-lined cap. Samples must be protected from direct sunlight. |
|
| Status of method: |
Evaluated method. This method that has been subjected to the established evaluation procedures of the
Organic Methods Evaluation Branch. |
|
| Date: July 1986 |
Chemist: Donald Burright |
Organic Methods Evaluation Branch
OSHA Analytical Laboratory
Salt Lake City, Utah
| Target concentrations: |
0.20 mg/m3 for Coal Tar Pitch Volatiles (PEL)
0.15 mg/m3 for Coke Oven Emissions (PEL)
8.88 µg/m3 (1.22 ppm) for phenanthrene
0.79 µg/m3 (0.11 ppm) for anthracene
9.00 µg/m3 (1.09 ppm) for pyrene
3.27 µg/m3 (0.35 ppm) for chrysene
2.49 µg/m3 (0.24 ppm) for benzo(a)pyrene |
|
Detection limits of the
overall procedure: |
0.006 mg/m3 for BSF
0.427 µg/m3 (59 ppb) for phenanthrene (PHEN)
0.028 µg/m3 ( 4 ppb) for anthracene (ANTH)
0.260 µg/m3 (31 ppb) for pyrene (PYR)
0.073 µg/m3 ( 8 ppb) for chrysene (CHRY)
0.045 µg/m3 ( 4 ppb) for benzo(a)pyrene (BaP) |
|
| Reliable quantitation limits: |
0.034 mg/m3 for BSF
0.740 µg/m3 (100 ppb) for PHEN
0.066 µg/m3 ( 9 ppb) for ANTH
1.13 µg/m3 (140 ppb) for PYR
0.273 µg/m3 ( 29 ppb) for CHRY
0.207 µg/m3 ( 20 ppb) for BaP |
|
Standard errors of estimate
at the target concentration:
(Section 4.6.) |
8.3% for BSF
6.0% for PHEN
6.8% for ANTH
6.7% for PYR
6.3% for CHRY
5.8% for BaP |
1. General Discussion
1.1. Background
1.1.1. History
Coal tar pitch volatiles (CTPV) include the fused polycyclic hydrocarbons which volatilize from the
distillation residues of coal, petroleum (excluding asphalt), wood, and other organic matter (Ref. 5.1.).
Coke oven emissions (COE) are the benzene-soluble fraction (BSF) of total particulate matter present during the
destructive distillation or carbonization of coal for the production of coke (Ref. 5.2.).
Coal tar is obtained by the distillation of bituminous coal (Ref. 5.3.). Coal tar pitch is
composed almost entirely of polynuclear aromatic compounds and constitutes 48-65% of the
usual grades of coal tar (Ref. 5.3.)
The purpose of this work was to evaluate the sampling and
analytical method routinely used by OSHA, and to make appropriate modifications if
necessary. That method required samples be collected with glass fiber filters (GFF) in
three-piece polystyrene cassettes. The sealed cassettes were shipped to the laboratory at
ambient temperature and upon receipt were stored in a refrigerator until analyzed. The
GFFs were placed in test tubes containing benzene and sonicated for 20 min. The resulting
solutions were filtered with fine fritted glass filter funnels. The GFFs were then rinsed
twice with benzene and the filtered rinses combined with the original extract. The benzene
extracts were concentrated to 1 mL. A 0.5-mL aliquot of each sample was taken to dryness
and the BSF was determined gravimetrically. The other half of each sample was saved to be
analyzed by HPLC if the BSF was over the PEL.
Alternate samplers were not considered because the OSHA
standard defines CTPV and COE as a function of those components that collected on a GFF.
However, the following modifications were made to the previous procedure to reduce costs
and improve the sensitivity and precision:
Samples are collected closed-face with a two-piece cassette containing a GFF and a backup pad.
A three-piece cassette is not necessary. The GFF is removed from the cassette and placed in a glass vial which is sealed with a cap
containing a polytetrafluoroethylene (PTFE) liner before shipment. This increases the recovery
of the analytes over the old procedure. The total extraction volume is reduced from 10 mL to 3 mL. This eliminates the concentration step
of the old procedure (concentration to 1 mL) and
greatly improves the recovery and precision. The extracted samples are filtered through pure PTFE
membrane filters instead of fritted-glass filter funnels. Blank corrections, which were
30-70 µg with the old procedure, are reduced to 5-20 µg.
The modified procedure resulting from this evaluation
requires that the GFFs be removed from the polystyrene cassettes before shipment and
placed in sealed vials. Three milliliters of benzene are added to the sample vials and
then the vials are placed in a mechanical shaker and shaken for 1 h. The resulting
solutions are filtered through pure PTFE membrane filters. One and one-half
milliliters of the benzene extract are taken to dryness and the BSF is determined
gravimetrically. The rest of the sample is saved to be analyzed by HPLC if the BSF is over the PEL.
The selected PAHs used in this evaluation are phenanthrene
(PHEN), anthracene (ANTH), pyrene (PYR), chrysene (CHRY), and benzo(a)pyrene
(BaP). These compounds are analyzed by HPLC and are marker
compounds to indicate the presence of PAHs. The presence of BaP,
identified by GC/MS, is used to confirm the presence of CTPV or COE when the BSF exceeds
the appropriate PEL.
1.1.2. Toxic effects (This section is for information only and should not be taken as a basis for OSHA policy.)
The following information was reported in "Occupational Health Guidelines for Chemical Hazards". (Ref. 5.4.)
Coal tar pitch volatiles (CTPV) are products of the
destructive distillation of bituminous coal and contain polynuclear aromatic hydrocarbons
(PNA's). These hydrocarbons sublime readily, thereby increasing the amounts of
carcinogenic compounds in the working areas. Epidemiologic evidence suggests that workers
intimately exposed to the products of combustion or distillation of bituminous coal are at
risk of cancer at many sites. These include cancer of the respiratory tract, kidney,
bladder, and skin. In a study of coke oven workers, the level of exposure to CTPV and the
length of time exposed were related to the development of cancer. Coke oven workers with
the highest risk of cancer were those employed exclusively at topside jobs for 5 or more
years, for whom the increased risk of dying from lung cancer was 10-fold; all coke oven
workers had a 7-1/2-fold increase in risk of dying from kidney cancer.
Although the causative agent or agents of the cancer in coke oven workers is unidentified,
it is suspected that several PNA's in the CTPV generated during the coking process are
involved. Certain industrial populations exposed to coal tar products have a demonstrated
risk of skin cancer. Substances containing PNA's which may produce skin cancer also
produce contact dermatitis; examples are coal tar, pitch and cutting oils. Although
allergic dermatitis is readily induced by PNA's in guinea pigs, it is only rarely reported
in humans from occupational contact with PNA's; these have resulted largely from
therapeutic use of coal tar preparations. Components of pitch and coal tar produces
cutaneous photosensitization; skin eruptions are usually limited to areas exposed to the
sun or ultraviolet light. Most of the phototoxic agents will induce hypermelanosis of the
skin; if chronic photodermatitis is severe and prolonged, leukoderma may occur. Some oils
containing PNA's have been associated with changes of follicular and sebaceous glands
which commonly take the form of acne. There is evidence that exposure to emissions at coke
ovens and gas retorts may be associated with an increased occurrence of chronic
bronchitis. Coal tar pitch volatiles may be associated with benzene, an agent suspected of
causing leukemia and known to cause aplastic anemia.
1.1.3. Operations where exposure may occur
In 1970, there were over 13,000 coke ovens in operation in the United States. It is estimated
that approximately 10,000 persons are potentially exposed to COE. (Ref. 5.5.)
Coal tar pitch is used in metal and foundry operations,
electrical equipment installations, pipe coating operations, and at construction sites.
About 145,000 people are potentially exposed to CTPV. (Ref. 5.6.)
The PAHs that were studied in this evaluation have been
found in many substances. These include coke oven emissions, coal tar pitch, creosote,
exhaust of internal combustion engines, and cooked meats. benzo(a)pyrene
and chrysene have also been isolated from cigarette smoke. (Refs. 5.5.-5.7.)
1.1.4. Physical properties (Ref. 5.8.)
| Phenanthrene |
|
| CAS no.: |
85-01-8 |
| MW: |
178.22 |
| bp: |
340°C at 760 mm Hg |
| mp: |
100°C |
| color: |
white crystals |
| structure: | Figure 1.1.4. |
|
| Anthracene |
|
| CAS no.: |
120-12-7 |
| MW: |
178.22 |
| bp: |
342°C at 760 mm Hg |
| mp: |
218°C |
| color: |
colorless crystals |
| structure: |
Figure 1.1.4. |
|
| Pyrene |
|
| CAS no.: |
129-00-0 |
| MW: |
202.24 |
| bp: |
404°C at 760 mm Hg |
| mp: |
156°C |
| color: |
colorless crystals |
| synonyms: |
benzo(def)phenanthrene |
| structure: |
Figure 1.1.4. |
|
| Chrysene |
|
| CAS no.: |
218-01-9 |
| MW: |
228.28 |
| bp: |
448°C at 760 mm Hg |
| mp: |
254°C |
| color: |
white crystals |
| synonyms: |
1,2-benzophenanthrene; benzo(a)phenanthrene |
| structure: |
Figure 1.1.4. |
|
| benzo(a)pyrene |
|
| CAS no.: |
50-32-8 |
| MW: |
252.30 |
| bp: |
311°C at 10 mm Hg |
| mp: |
179°C |
| color: |
yellow needles |
| synonyms: |
3,4-benzopyrene; 6,7-benzopyrene |
| structure: |
Figure 1.1.4. |
|
| Benzene-soluble fraction
(The sum of those components collected on a GFF and soluble in benzene.) |
|
| color: |
brownish-yellow to black tar |
1.2. Limit defining parameters (The analyte air
concentrations listed throughout this method are based on an air volume of 960 L and a
solvent extraction volume of 3 mL. Air concentrations listed in ppm are referenced to
25°C and 760 mm Hg.)
1.2.1. Detection limits of the analytical procedure
1.2.1.1. Benzene-soluble fraction
The detection limit of the analytical procedure is 6 µg per sample and is based on the
precision of the analytical balance used. This is the weight which corresponds to twice the
standard deviation of the precision data for a 50-mg weight, which is the approximate
weight of an average PTFE cup. (Sections 4.1.1. and 4.4.1.)
The detection limit also takes into account the dilution factor of 2.
1.2.1.2. Selected PAHs
The detection limits of the analytical procedure are listed
below. These are the amounts of analyte which will give a peak whose height is about five
times the height of the baseline noise. (Section 4.1.2.)
Table 1.2.1.2.
Analytical Detection Limits
|
| compound |
ng/injection |
detector* |
|
PHEN
PHEN
ANTH
PYR
CHRY
BaP |
0.132
0.910
0.090
0.960
0.386
0.175 |
UV(254 nm)
FL
FL
FL
FL
FL |
|
| * Fluorescence was more sensitive than UV for each PAH except PHEN |
1.2.2. Detection limits of the overall procedure
The detection limits of the overall procedure are listed
below. These are the amounts of analyte, determined from Figures 4.2.1.-4.2.6.,
which when spiked onto the sampling device would allow recovery of an amount of analyte equivalent to
the detection limits of the analytical procedure. (Section 4.2.)
Table 1.2.2.
Detection Limits of the Overall Procedure
|
|
BSF |
PHEN |
ANTH |
PYR |
CHRY |
BaP |
|
µg/sample
µg/m3
ppb |
6
6
-- |
0.41
0.43
59 |
0.027
0.028
4 |
0.25
0.26
31 |
0.070
0.073
8 |
0.043
0.045
4 |
|
1.2.3. Reliable quantitation limits
The reliable quantitation limits are listed below. These
are the smallest amounts of analyte which can be quantitated within the requirements of a
recovery of at least 75% and a precision (±1.96 SD) of ±25% or better. (Section 4.3.)
Table 1.2.3.
Reliable Quantitation Limits
|
|
BSF |
PHEN |
ANTH |
PYR |
CHRY |
BaP |
|
µg/sample
µg/m3
ppb |
33.1
34.5
-- |
0.71
0.74
100 |
0.064
0.066
9 |
1.08
1.13
140 |
0.262
0.273
29 |
0.199
0.207
20 |
|
The reliable quantitation limit and detection limits
reported in the method are based upon optimization of the instrument for the smallest
possible amount of analyte. When the target concentration of an analyte is exceptionally
higher than these limits, they may not be attainable at the routine operating parameters
1.2.4. Sensitivities
The sensitivities of the analytical procedure over a
concentration range representing about 0.5 to 2 times the target concentrations are listed
below. These values were determined by the slope of the calibration curves. (Section 4.4.)
The sensitivity will vary with the particular instrument used in the analysis. The values
listed were obtained using an µL detector.
Table 1.2.4.
Sensitivities of Selected PAHs
|
| compound |
area counts/(µg/mL) |
|
PHEN
ANTH
PYR
CHRY
BaP |
19000
178000
21100
58900
125000 |
|
1.2.5. Recoveries
The recovery of analytes from samples stored in vials used
in the 15-day storage test remained above the percentages listed below. (Section 4.6.) The
recovery of the analytes from the collection medium during storage must be 75% or greater.
Table 1.2.5.
Recoveries from Ambient Storage
|
| compound |
% recovery |
|
BSF
PHEN
ANTH
PYR
CHRY
BaP |
89.4
92.2
90.7
86.9
96.2
99.9 |
|
1.2.6. Precisions (analytical procedure)The pooled coefficients of variation obtained from replicate
determinations of analytical standards at about 0.5 to 2 times the target concentration are shown below.
The values were obtained using an µL detector. (Section 4.4.)
Table 1.2.6.
Analytical Precision
|
| compound |
CV |
|
PHEN
ANTH
PYR
CHRY
BaP |
0.0092
0.0051
0.0128
0.0094
0.0150 |
|
1.2.7. Precisions (overall procedure)
The precisions at the 95% confidence level for the 15-day ambient storage tests are listed below. (Section 4.6.)
These include an additional ±5% for sampling error. The overall procedure must provide results at the target
concentration that are ±25% or better at the 95% confidence level.
Table 1.2.7.
Precision of the Overall Procedure
|
| compound |
percent |
|
BSF
PHEN
ANTH
PYR
CHRY
BaP |
16.2
11.8
13.4
13.0
12.3
11.3 |
|
1.2.8. Reproducibilities
Six samples, spiked with coal tar by liquid injection, and a draft copy of this procedure were given to a
chemist unassociated with this evaluation. The samples were analyzed after 21 days of storage at about 22°C.
Another set of six samples, spiked with PAHs by liquid injection, and a draft copy of this procedure were given
to another chemist unassociated with this evaluation. The samples were analyzed after 3 days of storage at
about 22°C. The average recoveries are listed below. (Section 4.7.)
Table 1.2.8.
Reproducibilities
|
| compound |
mean |
percent |
|
BSF
PHEN
ANTH
PYR
CHRY
BaP |
94.2
98.0
90.4
101.4
98.7
100.6 |
5.4
3.4
2.4
3.4
2.7
3.0 |
|
1.3. Advantages
1.3.1. Recovery of the analytes is improved by placing the GFF in sealed glass vials before shipment.
1.3.2. The amount of benzene required for each sample is reduced from 10 mL to 3 mL per sample. This reduces the exposure to a suspected human carcinogen.
1.3.3. The reliable quantitation limits are much lower than those of the previously used procedure.
1.3.4. The use of pure PTFE membrane filters, instead of fritted glass filter funnels, lowers the blank correction and provides much better precision.
1.3.5. The amount of time samples spend in the nitrogen evaporator for the previous procedure is eliminated, a savings of about 2 h.
1.4. Disadvantages
The GFF must be transferred from the cassette to a scintillation vial by the industrial hygienist.
2. Sampling Procedure
2.1. Apparatus
2.1.1. A personal sampling pump that can be calibrated to within ±5% of the recommended flow rate with the sampling device in line.
2.1.2. A two-piece cassette containing a glass fiber filter is the sampling device.
2.1.3. Forceps to transfer the GFF to a scintillation vial.
2.1.4. Scintillation vials with PTFE-lined caps.
2.1.5. Aluminum foil or an opaque container to protect collected samples from light.
2.2. Reagents
No sampling reagents are required.
2.3. Sampling technique
2.3.1. Attach the cassette to the sampling pump with flexible, plastic tubing so that the GFF in the sampling
cassette is exposed directly to the atmosphere. Do not place any tubing in front of the sampler. The sampler
should be attached vertically in the worker's breathing zone in such a manner that it does not impede work
performance. The sampling device should be protected from direct sunlight (Ref. 5.9.).
2.3.2. After sampling for the appropriate time, remove the sampling device and install the two plastic plugs in
the open ends of the cassette.
2.3.3. As soon as it is conveniently possible, but before the sample is shipped, fold the filter into quarters
(sampling surface inside) and insert it into a scintillation vial (Figure 2.3.3.). Always
handle the GFF with clean forceps. To avoid losing any particulate material, the inside of the cassette should
be wiped with the folded filter. Install a cap that has a PTFE liner, not a Poly-seal cap. Wrap each
vial in aluminum foil or place it in an opaque container to protect the sample from light.
2.3.4. Wrap each sample end-to-end with an OSHA seal (Form 21).
2.3.5. Submit at least one blank with each set of samples. The blank should be handled the same as the other
samples except that no air is drawn through it.
2.4. Extraction efficiencies
The average extraction efficiencies of the analytes are listed below. The target concentrations were used for
this determination. (Section 4.5.)
Table 2.4.
Extraction Efficiency from GFF
|
| compound |
percent |
|
BSF
PHEN
ANTH
PYR
CHRY
BaP |
100.3
105.9
112.5
101.4
107.5
108.7 |
|
2.5. Recommended air volume and sampling rate
2.5.1. The recommended air volume is 960 L.
2.5.2. The recommended air sampling rate is 2.0 L/min.
2.6. Interferences (sampling)
Suspected interferences should be reported to the laboratory with submitted samples.
2.7. Safety precautions (sampling)
The sampling equipment should be attached to the worker in such a manner that it will not interfere with work performance or safety.
3. Analytical Procedure
3.1. Apparatus
3.1.1. Benzene-soluble fraction
3.1.1.1. A calibrated microbalance capable of determining a weight to the nearest microgram. A Mettler
M3-03 balance with a data transfer recorder was used in this evaluation.
3.1.1.2. Thirteen-millimeter stainless steel filter holder with a female Luer-Lok fitting.
3.1.1.3. Thirteen-millimeter pure PTFE membrane filters with 5-µm pores.
3.1.1.4. Two-milliliter PTFE cups, Cahn Scientific.
3.1.1.5. Two-milliliter disposable pipets.
3.1.1.6. Ten-milliliter glass syringe barrels with male Luer-Lok fittings.
3.1.1.7. Disposable culture tubes (13 × 100 mm).
3.1.1.8. Vacuum oven.
3.1.1.9. Mechanical shaker.
3.1.1.10. Forceps.
3.1.2. Selected PAHs
3.1.2.1. High performance liquid chromatograph equipped with a fluorescence
(µL) or an ultraviolet (UV) detector, manual or automatic injector, gradient flow programmer and chart
recorder. A Waters M-6000A pump, Waters WISP 710B autosampler, Waters 660 solvent programmer,
Schoeffel 970 µL detector, Waters 440 UV detector, and a Houston dual pen recorder were used in this evaluation.
3.1.2.2. HPLC column capable of separating PAHs from any interferences. A 25-cm ×
4.6-mm i.d. DuPont Zorbax ODS (6 µm) column was used during this evaluation.
3.1.2.3. An electronic integrator, or some other suitable method of measuring detector response.
3.1.2.4. Vials, 4-mL with PTFE-lined caps.
3.1.2.5. Volumetric flasks, pipets, and syringes.
3.2. Reagents
3.2.1. Acetonitrile (ACN), HPLG grade.
3.2.2. Water, HPLC grade. A Millipore Milli-Q system was used to prepare the water for this evaluation.
3.2.3. Benzene, HPLC grade.
3.2.4. Nitrogen gas.
3.2.5. Phenanthrene (PHEN).
3.2.6. Anthracene (ANTH).
3.2.7. Pyrene (PYR).
3.2.8. Chrysene (CHRY).
3.2.9. benzo(a)pyrene (BaP).
3.2.10. Tetrahydrofuran (THF), HPLC grade.
3.3. Standard preparation for selected PAHs
A stock standard solution is prepared by dissolving the PAHs in benzene. All dilutions of the stock solutions
are made with benzene to arrive at the working range.
3.4. Sample preparation
3.4.1. Benzene-soluble fraction (CAUTION - All work with benzene must be done in a fume hood.)
3.4.1.1. Clean the PTFE cups by sonicating them in THF for a few minutes, and rinsing them twice with clean THF.
Place the cups into a numbered holder. The cups are placed in a preheated oven (40°C under about 20 in. Hg
vacuum) for 1 h. The cups are allowed to cool to room temperature and weighed to the nearest microgram. Handle
the cups with clean, dry forceps.
3.4.1.2. Pipet 3.0 mL of benzene to each scintillation vial containing the sample filter.
3.4.1.3. Shake the vials for 60 min.
3.4.1.4. Insert a 13-mm pure PTFE membrane filter (5-µm) into the stainless steel holder and attach the
holder to a syringe barrel. Add about 3 mL of benzene to the syringe and push the benzene through the filtering
unit with nitrogen to check for leaks. A rubber stopper is used on the nitrogen line to pressurize the syringe
barrel to 10 psig. Dry the filter by allowing the nitrogen to pass through the filter for 30 s.
3.4.1.5. Transfer the benzene extract from the vial into the syringe barrel, one sample per syringe. If the vial
contains a considerable amount of particulate material, decant the extract into the syringe barrel. Push the benzene
extract thru the filters into the disposable culture tube (13 × 100 mm) with nitrogen gas.
3.4.1.6. Pipet 1.5 mL of the benzene extract to a tared PTFE cup.
3.4.1.7. Place the PTFE cups in a preheated oven (40°C under about 15 in. Hg vacuum). Provide some air flow
in the oven to sweep benzene vapor out of the oven. Heat the cups for about 3 to 4 h. Close the vent valve for the
last hour of the drying period.
3.4.1.8. Remove the PTFE cups from the oven and allow them to cool to room temperature. Weigh the cups to the nearest microgram.
3.4.2. Selected PAHs
Transfer the remaining benzene solution from the culture tube to a vial and seal with a PTFE-lined
cap. This fraction of the sample will be analyzed for PAHs if the concentration of the BSF is equal to or greater than the PEL.
3.5. Analysis
3.5.1. Reverse phase HPLC conditions
| column: |
25-cm × 4.6-mm i.d. stainless steel column packed with 6-µm DuPont Zorbax ODS |
| mobile phase: | 85:15 ACN/water (v/v) |
| flow rate: | 1.0 mL/min for 5 min, Curve 10 (flow program) for 5 min to 1.5 mL/min, then hold for 10 min |
| µL detector: | 254 nm excitation
370 nm emission |
| UV detector: | 254 nm |
| injection size: | 10 µL |
| retention time: | 7-18 min |
| chromatogram: | Figure 3.5.1. |
3.5.2. An external standard procedure is used to prepare a calibration curve using at least 2 stock solutions
from which dilutions are made. The calibration curve is prepared daily. The samples are bracketed with
analytical standards.
3.6. Interferences (analytical)
3.6.1. Benzene-soluble fraction
3.6.1.1. Any compound that is soluble in benzene and is not normally found in coal tar pitch volatiles or coke
oven emissions is an interference. Anything that falls into or adheres to the PTFE cups during the time between
weighings will give high results.
3.6.1.2. It has been reported that mineral oil is an interference with the BSF determination in the aluminum
industry (Ref. 5.10.). The problem of separating mineral oil from the BSF was not addressed in this evaluation
but a status report from the Aluminum Association Health Committee showed that the ANCAL IATROSCAN
TH-10 could quantitate the amounts of oil and BSF separately. This is done by using a special
thin-layer chromatography rod that is analyzed by a flame ionization detector after a separation
has been completed with the rod. The report indicated good agreement between the total amount of oil and BSF
by the Iatroscan method and weight of BSF determined gravimetrically. (Ref. 5.11.)
3.6.2. Selected PAHs
3.6.2.1. Any compound having a similar retention time as the PAHs is a potential interference. Generally,
chromatographic conditions can be altered to separate an interference from the analyte.
3.6.2.2. Retention time on a single column is not proof of chemical identity. Analysis by an alternate HPLC
column, absorbance response ratioing, and mass spectrometry are additional means of identification.
3.7. Calculations
3.7.1. Benzene-soluble fraction
The concentration in µg/m3 of BSF present in a sample is determined from the two
weighings (in micrograms) of the PTFE cup. The factor "2" in the equation compensates for the fact that only 1/2
of the sample was used for the gravimetric procedure.
| µg/m3 = |
2[(final wt - tare wt) - (blank final wt - tare wt)]
(air volume, m3) |
3.7.2. Selected PAHs
The concentration in µg/mL of the PAHs present in a sample is determined from the detector response of the
analytes. Comparison of sample response with a least squares curve fit for standards allows the analyst to determine
the concentration of the PAHs in µg/mL for the sample. Since the total sample volume was 3 mL, the results in
µg/m3 of air are expressed by the following equation:
µg/m3 = 3 mL(µg/mL)/[(air vol., m3)(extrac. effic.)]
This value can be converted to an equivalent concentration in parts per million with the following equation:
ppm = (mg/m3)(24.46)/MW
| where |
24.46
MW |
=
= |
molar volume at 25°C and 760 mm Hg
molecular weight of PAH |
3.8. Safety precautions (analytical)
3.8.1. Avoid exposure to all standards.
3.8.2. Avoid skin contact with all solvents.
3.8.3. Wear safety glasses at all times.
3.8.4. All work with benzene is to be performed in a fume hood. Benzene is a suspected human carcinogen.
4. Backup Data
4.1. Detection limit of the analytical procedure
4.1.1. Benzene-soluble fraction
The detection limit of the analytical procedure is 6 µg per sample. This is the weight which corresponds
to twice the standard deviation of the precision data for a 50-mg weight, the weight of an average
PTFE cup. The data presented in Table 4.4.1. are applicable only to the Mettler M3-03 balance used
in this evaluation. The detection limit also takes into account the dilution factor of 2.
4.1.2. Selected PAHs
The detection limits of the analytical procedure are listed below and were determined by injecting 10 µL
of a standard. These amounts produced peaks whose heights were about 5 times the height of the baseline noise.
The injection volume recommended in the analytical procedure (10 µL) was used in the determination of the
detection limits for the analytical procedure. (Figures 4.1.2.1.-4.1.2.5. show chromatographs obtained with
the µL detector.)
Table 4.1.2.
Analytical Detection Limits
|
| compound |
µg/mL |
ng/injection |
detector |
|
BSF
PHEN
ANTH
PYR
CHRY
BaP |
0.0132
0.0910
0.0090
0.0960
0.0386
0.0175 |
0.132
0.910
0.090
0.960
0.386
0.175 |
UV (254 nm)
FL
FL
FL
FL
FL |
|
4.2. Detection limit of the overall procedure
The detection limits of the overall procedure are listed in Table 4.2. The values were determined graphically
(Figures 4.2.1.-4.2.6.) by plotting amount spiked versus amount
recovered and determining the amount that corresponds to the analytical detection limit. The values listed are
based on an µL detector.
Table 4.2.
Detection Limits of the Overall Procedure
|
|
BSF |
PHEN |
ANTH |
PYR |
CHRY |
BaP |
|
µg/sample
µg/m3
ppb |
6
6
-- |
0.41
0.43
59 |
0.027
0.028
4 |
0.25
0.26
31 |
0.070
0.073
8 |
0.043
0.045
4 |
|
4.3. Reliable quantitation limit
4.3.1. Benzene-soluble fraction
The reliable quantitation limit is 33.1 µg (34.5 µg/m3) of BSF per sample.
Seven samples were prepared by injecting 4 µL of a coal tar solution (8.28 mg/mL) onto GFFs. The samples
were analyzed the same day and the average results are reported in Table 4.3.1.
Table 4.3.1.
Reliable Quantitation Limit
|
| Sample |
% Recovery |
|
1
2
3
4
5
6
7
SD = 8.7 |
99.7
93.7
86.6
99.7
105.7
81.6
87.6
 = 93.5 = 93.5
1.96 SD = 17.1 |
|
4.3.2. Selected PAHs
The reliable quantitation limits are listed below. Six samples were prepared by injecting several microliters
of a benzene solution containing PAHs onto GFFs. The samples were analyzed the same day.
Table 4.3.2.
Reliable Quantitation Limit
|
analyte
spike (µg)
(µg/m3)
(ppb) |
PHEN
0.71
0.74
100 |
ANTH
0.064
0.066
9 |
PYR
1.08
1.13
140 |
CHRY
0.262
0.273
29 |
BaP
0.199
0.207
20 |
|
% recovery
SD
1.96 SD |
94.7
92.7
91.1
89.9
91.0
97.9
92.9
3.0
5.8 |
90.1
91.2
89.4
86.4
87.0
87.0
88.5
2.0
3.9 |
91.1
102.0
92.2
93.9
82.3
86.9
91.4
6.7
13.1 |
93.3
96.3
97.5
94.9
93.8
97.0
95.5
1.7
3.4 |
97.0
105.4
102.5
98.6
99.3
95.7
99.8
3.6
7.1 |
|
4.4. Sensitivity and precision (analytical method only)
4.4.1. Precision data for the benzene-soluble fraction
The following data were obtained from multiple weighings of calibration weights that are approximately 0.5 to 2
times the nominal weight of a PTFE cup. This was done to establish the precision of the analytical balance.
Table 4.4.1.
Precision Data
|
|
25 mg |
50 mg |
100 mg |
|
SD
CV |
25.005
25.003
25.007
25.007
25.005
25.006
25.005
25.006
25.008
25.006
25.006
0.0014
0.00006 |
49.991
49.990
49.993
49.993
49.993
49.994
49.992
49.992
49.994
49.994
49.993
0.0015
0.00003 |
99.998
100.001
100.001
100.001
100.002
100.002
100.000
100.000
100.000
100.003
100.001
0.0013
0.00001 |
|
4.4.2. Sensitivity and precision data for selected PAHs
The following data were obtained from multiple injections of analytical standards. This data was used to
establish calibration curves for each analyte from which the sensitivity was determined. The data are also
presented graphically in Figures 4.4.2.1.-4.4.2.5.
Table 4.4.2.1.
Precision and Sensitivity Data
Approximately 0.5× Target Concentration
|
analyte
µg/mL |
PHEN
2.49 |
ANTH
0.255 |
PYR
2.94 |
CHRY
1.27 |
BaP
0.525 |
|
areas
SD
CV |
45900.5
47374.6
47183.4
46965.1
46142.1
46512.1
46679.6
590.3
0.0126 |
51249.6
51970.1
52000.0
51575.7
51108.6
51627.2
51588.5
363.8
0.0071 |
62246.7
65309.6
64947.2
65054.5
63987.1
64048.0
64265.5
1129.4
0.0176 |
75163.5
77086.5
77164.0
77073.2
75900.5
76050.7
76406.4
825.6
0.0108 |
66750.5
69435.0
68508.0
68420.0
67441.5
67287.0
67973.7
987.0
0.0145 |
|
Table 4.4.2.2.
Precision and Sensitivity Data
Approximately 1× Target Concentration
|
analyte
µg/mL |
PHEN
4.98 |
ANTH
0.51 |
PYR
5.88 |
CHRY
2.54 |
BaP
1.05 |
|
areas
SD
CV |
89773.1
89874.4
89365.4
89247.6
88542.6
89070.5
89312.3
487.1
0.0055 |
103477
103385
103311
103251
102573
103281
103213
324
0.0031 |
126795
127081
126379
125730
125370
126281
126273
630
0.0051 |
151961
152486
151748
150675
149400
150541
151135
1136
0.0075 |
136383
136615
135617
134451
134111
134593
135295
1061
0.0078 |
|
Table 4.4.2.3.
Precision and Sensitivity Data
Approximately 2× Target Concentration
|
analyte
µg/mL |
PHEN
9.71 |
ANTH
0.99 |
PYR
11.76 |
CHRY
5.08 |
BaP
2.10 |
|
areas
SD
CV |
184607
180064
182561
182924
182992
183198
182724
1482
0.0081 |
182281
184202
183493
183448
183215
184599
183540
808
0.0044 |
248424
247112
246260
252779
253143
252296
250002
3088
0.0124 |
299267
297709
297519
302237
303651
303771
300692
2885
0.0096 |
262309
260233
259748
271134
269743
270109
265546
5329
0.0201 |
|
Table 4.4.2.4.
The Pooled Coefficients of Variation
|
| PHEN |
ANTH |
PYR |
CHRY |
BaP |
|
| 0.0092 |
0.0051 |
0.0128 |
0.0094 |
0.0150 |
|
4.5. Extraction efficiency
4.5.1. Benzene-soluble fraction
The following data represent the analysis of GFFs that were liquid spiked with coal tar solution prepared by
the procedure in Section 4.8. at the target concentration (207 µg/GFF). These data only show that compounds
derived from the specially prepared coal tar pitch solution can be extracted from a GFF. Since the BSF is a
collection of many compounds, the extraction efficiency is not applied to the calculations. The PTFE cups
were reweighed 24 h later and the results were still valid.
Table 4.5.1.
Extraction Efficiency of Benzene-solubles
|
|
first day |
24 h later |
|
percent
recovered
SD |
98.1
98.1
100.0
100.0
97.1
105.8
102.9
100.3
3.1 |
102.9
101.0
100.0
99.0
99.0
106.8
107.7
102.3
3.6 |
|
4.5.2. Selected PAHs
The data listed below represent the results of the analysis of GFFs that were liquid spiked with PAHs at the
target concentration. These samples were allowed to dry and then extracted with benzene and analyzed the same
day. The samples were reanalyzed 24 hr later and found to be stable (Table 4.5.2.2.).
Table 4.5.2.1.
Extraction Efficiency of Selected PAHs
|
analyte
µg/sample |
PHEN
8.5 |
ANTH
0.76 |
PYR
8.6 |
CHRY
3.1 |
BaP
2.4 |
|
% recovery
SD |
107.6
108.9
104.8
104.6
106.8
106.0
104.4
104.0
105.9
1.8 |
117.7
117.0
110.0
109.9
112.0
113.0
111.5
108.7
112.5
3.3 |
106.3
110.0
100.9
96.6
98.7
100.3
101.0
97.0
101.4
4.6 |
111.6
112.0
105.2
103.8
107.9
108.0
106.7
104.7
107.5
3.1 |
110.9
113.2
105.9
105.2
109.3
110.4
108.2
106.5
108.7
2.8 |
|
Table 4.5.2.2.
Extraction Efficiencies 24 Hours Later
|
analyte
µg/sample |
PHEN
8.5 |
ANTH
0.76 |
PYR
8.6 |
CHRY
3.1 |
BaP
2.4 |
|
% recovery
SD |
115.9
114.5
110.9
111.5
108.6
106.3
108.7
107.3
110.5
3.4 |
121.3
119.0
116.4
117.8
116.6
109.5
110.4
111.3
115.3
4.4 |
118.4
117.7
111.4
110.3
111.2
102.3
104.7
102.9
109.9
6.2 |
119.2
119.7
112.9
115.0
113.7
106.9
109.7
107.6
113.1
4.9 |
122.3
120.3
118.9
119.5
115.8
112.5
110.1
111.7
116.4
4.5 |
|
4.6. Storage data
Storage samples were generated by liquid spiking 36 GFFs with coal tar and another 36 GFFs with PAHs. All of the
spiked GFFs were stored in sealed glass vials. One-half of the vials were stored in a freezer at -20°C and the
other half were stored in a closed drawer at ambient temperature (about 22°C). The results (percent recovery
versus storage time) are given in Tables 4.6.2.-4.6.3. and shown graphically in Figures 4.6.1.-4.6.12.
Table 4.6.1.
Amount Spiked (µg/GFF)
|
| BSF |
PHEN |
ANTH |
PYR |
CHRY |
BaP |
|
| 207 |
8.5 |
0.76 |
8.6 |
3.1 |
2.4 |
|
Table 4.6.2.
Ambient Storage Test (% recovery)
|
| day |
BSF |
PHEN |
ANTH |
PYR |
CHRY |
BaP |
|
0
3
6
9
12
15 |
100.5
89.9
90.8
91.8
78.3
88.9
90.8
99.5
73.4
87.4
90.3
87.4
86.5
91.3
90.3
100.5
87.0
93.7
91.8
85.0
85.0 |
108.8
107.8
102.4
103.7
100.8
102.9
98.5
97.5
98.3
99.6
104.1
103.0
94.2
101.2
97.5
88.1
93.1
91.7
92.0
94.9
95.2 |
113.0
113.4
108.5
108.5
110.4
109.6
104.3
103.2
100.2
99.3
104.7
105.9
94.6
104.6
98.4
84.3
88.9
88.7
93.1
99.0
95.3 |
105.9
105.4
100.3
102.6
101.1
100.1
91.3
95.3
91.5
99.4
101.1
105.3
90.4
91.5
91.5
82.5
93.2
89.6
85.5
89.0
88.8 |
108.8
108.3
105.0
105.3
104.4
102.8
97.9
100.3
98.8
102.8
108.7
110.5
102.0
101.4
99.2
92.4
96.6
96.7
94.4
100.1
95.3 |
110.2
109.5
105.0
110.2
105.5
107.3
101.4
102.7
100.6
105.3
108.9
108.4
104.0
103.5
101.5
97.3
104.6
101.0
97.3
101.9
100.0 |
|
Table 4.6.3.
Refrigerated Storage Test (% recovery)
|
| day |
BSF |
PHEN |
ANTH |
PYR |
CHRY |
BaP |
|
0
3
6
9
12
15 |
100.5
89.9
90.8
91.8
78.3
88.9
86.0
84.1
92.8
90.3
92.3
98.1
88.4
86.5
93.2
94.7
92.8
108.2
90.8
90.8
84.1 |
108.8
107.8
102.4
103.7
100.8
102.9
98.9
99.0
98.3
105.0
101.7
99.3
97.6
95.4
95.4
95.8
96.3
98.3
96.5
95.2
101.6 |
113.0
113.4
108.5
108.5
110.4
109.6
103.3
102.6
101.3
110.6
106.6
104.4
100.3
99.9
97.5
96.7
99.4
99.0
100.6
101.1
105.2 |
105.9
105.4
100.3
102.6
101.1
100.1
92.7
95.9
92.8
100.2
95.5
95.6
91.3
88.1
87.0
89.6
96.0
90.1
94.8
90.9
98.5 |
108.8
108.3
105.0
105.3
104.4
102.8
100.7
98.9
99.0
105.0
102.9
102.2
99.3
98.8
96.1
96.0
99.6
95.4
100.6
98.9
102.8 |
110.2
109.5
105.0
110.2
105.5
107.3
104.5
102.3
104.1
107.5
106.1
105.6
101.0
101.3
98.6
107.6
103.2
101.8
97.7
100.7
107.9 |
|
4.7. Reproducibility data
Six samples, spiked with coal tar by liquid injection, and a draft copy of this procedure were given to a chemist
unassociated with this evaluation. The samples were analyzed after 21 days of storage at about 22°C. Another
set of six samples, spiked with PAHs by liquid injection, and a draft copy of this procedure were given to another
chemist unassociated with this evaluation. The samples were analyzed after 3 days of storage at about 22°C.
All the results are corrected for extraction efficiency except for the BSF data and are listed below.
Table 4.7.
Reproducibility Results (percent of theoretical amount)
|
|
BSF |
PHEN |
ANTH |
PYR |
CHRY |
BaP |
|
SD |
101.4
90.8
87.0
92.8
99.5
93.9
94.2
5.4 |
99.1
97.8
91.8
101.8
99.8
97.8
98.0
3.4 |
91.7
93.0
86.1
90.9
90.9
89.6
90.4
2.4 |
105.4
104.8
96.5
101.7
100.4
99.3
101.4
3.4 |
102.2
101.6
95.5
98.4
98.1
96.5
98.7
2.7 |
105.0
103.4
97.5
100.4
99.2
98.3
100.6
3.0 |
|
4.8. Preparation of benzene-soluble standards used in evaluation
In this evaluation three different types of coal tar pitch were chosen at random from a collection of several
confired coal tar pitch materials. Twenty grams of each pitch were placed in beakers containing 100 mL of benzene
and sonicated for 1.5 h. The solutions were then combined and filtered twice with a fine fritted-glass filter
funnel. The resultant solution was then passed through a glass fiber filter. The solution was concentrated
with a stream of dry nitrogen and the gooey tar was placed in a heated oven (60°C under 20 in. Hg vacuum)
for 4 h. A portion of the "dried" tar was used to prepare a stock solution in benzene. This was used to spike
filters approximating a Coal Tar Pitch Volatile sample.

Figure 1.1.4. Structures of the selected PAHs.

Figure 2.3.3. Folding procedure for the glass fiber filter.
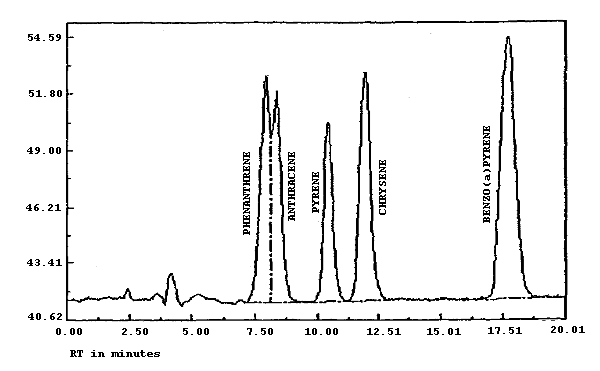
Figure 3.5.1. Chromatogram of selected PAHs at the target concentration.

Figure 4.1.2.1. Analytical detection limit for phenanthrene.

Figure 4.1.2.2. Analytical detection limit for anthracene.

Figure 4.1.2.3. Analytical detection limit for pyrene.

Figure 4.1.2.4. Analytical detection limit for chrysene.

Figure 4.1.2.5. Analytical detection limit for benzo(a)pyrene.

Figure 4.2.1. Detection limit of the overall procedure for benzene-soluble fraction.

Figure 4.2.2. Detection limit of the overall procedure for phenanthrene.

Figure 4.2.3. Detection limit of the overall procedure for anthracene.

Figure 4.2.4. Detection limit of the overall procedure for pyrene.

Figure 4.2.5. Detection limit of the overall procedure for chrysene.

Figure 4.2.6. Detection limit of the overall procedure for benzo(a)pyrene.

Figure 4.4.2.1. Calibration curve for phenanthrene.

Figure 4.4.2.2. Calibration curve for anthracene.

Figure 4.4.2.3. Calibration curve for pyrene.

Figure 4.4.2.4. Calibration curve for chrysene.

Figure 4.4.2.5. Calibration curve for benzo(a)pyrene.

Figure 4.6.1. Ambient storage test for benzene-soluble fraction.

Figure 4.6.2. Ambient storage test for phenanthrene.

Figure 4.6.3. Ambient storage test for anthracene.

Figure 4.6.4. Ambient storage test for pyrene.

Figure 4.6.5. Ambient storage test for chrysene.

Figure 4.6.6. Ambient storage test for benzo(a)pyrene.

Figure 4.6.7. Refrigerated storage test for benzene-soluble fraction.

Figure 4.6.8. Refrigerated storage test for phenanthrene.

Figure 4.6.9. Refrigerated storage test for anthracene.

Figure 4.6.10. Refrigerated storage test for pyrene.

Figure 4.6.11. Refrigerated storage test for chrysene.

Figure 4.6.12. Refrigerated storage test for benzo(a)pyrene.
5. References
5.1. Code of Federal Regulations, Title 29; 1910.1002, p671, Washington, DC, 1984.
5.2. Code of Federal Regulations, Title 29; 1910.1029, p789, Washington, DC, 1984.
5.3. "Condensed Chemical Dictionary", 10th ed.; Van Nostrand Reinholt Co.: New York, 1981.
5.4. "Occupational Health Guidelines for Chemical Hazards", NIOSH/OSHA, Jan. 1981, DHHS(NIOSH) Publication No. 81-123.
5.5. "Criteria for a Recommended Standard...Occupational Exposure to Coke Oven Emissions", Department of Health, Education and Welfare; National Institute for Occupational Safety and Health: Cincinnati, OH, 1973; DHEW(NIOSH) Publication No. 73-11016.
5.6. "Criteria for a Recommended Standard...Occupational Exposure to Coal Tar Products", Department of Health, Education and Welfare; National Institute for Occupational Safety and Health: Cincinnati, OH, 1977; DHEW(NIOSH) Publication No. 78-107.
5.7. "IARC Monographs on the Evaluation of the Carcinogenic Risk of Chemicals to Man, Certain Polycyclic Aromatic Hydrocarbons and Heterocyclic Compounds", Lyon, 1973, Vol. 3, 91-136 and 159-177.
5.8. Windholz, M., Ed. "Merck Index", 10th ed.; Merck and Co: Rahway, NJ, 1983.
5.9. Korfmacher, W.A.; Wehry, E.L.; Mamantov, G.; Natusch, D.F.S., Environ. Sci. Technol., 1980, 14(6), 1094.
5.10. Balya, D.R.; Danchik, R.S. Am. Ind. Assoc. J. 1984, 45(4), 260.
5.11. Danchik, R.S.; Balya, D.R., Aluminum Company of America, July, 1984, personal communication.
|
