Skip all navigation and jump to content Jump to site navigation Jump to section navigation.
NASA Logo - Goddard Space Flight Center + Visit NASA.gov
HOME PROJECTS RESOURCES SEARCH MAP

+ Advanced Search
Home
Home
View Most Recently Released Imagery
View Gallery of Imagery: A topical collection of SVS Imagery
Search Imagery by the keywords assigned to it
Search Imagery by the instruments that supplied data for a visualization product
Search Imagery by the series of visualizations that have been produced
Search Imagery by the scientist providing the data used in a visualization product
Search Imagery by the animator that created the product
Search Imagery by the identification number assigned to the visualization product
See other search options
Learn about the SVS Image Server
  + About the Server
  + Animation List
  + How to Use the Server


  + RSS Feeds
blank image
Previous Animation
Next Animation
Sea Ice Yearly Minimum 1979-2007

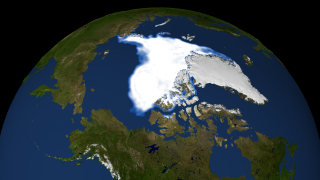
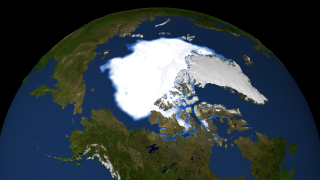
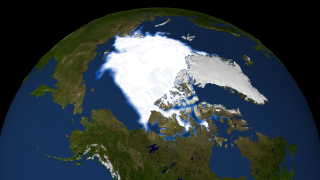
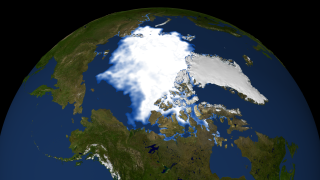
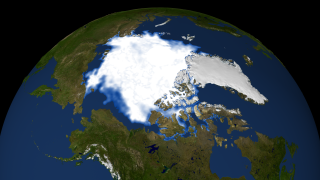
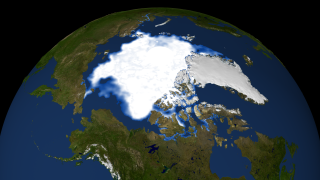
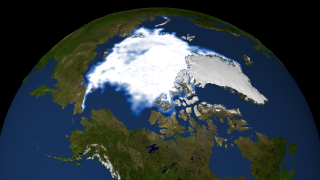
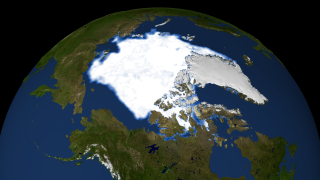
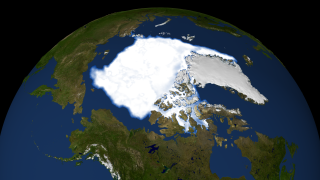
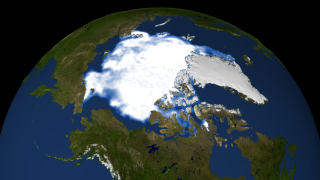
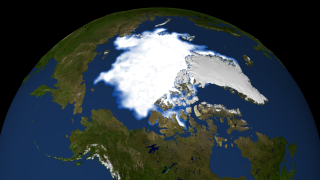
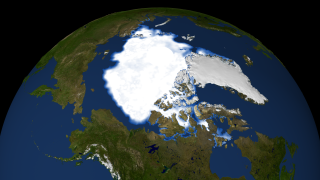
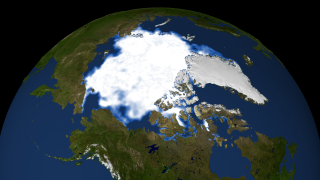
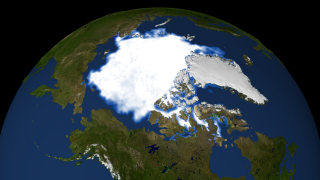
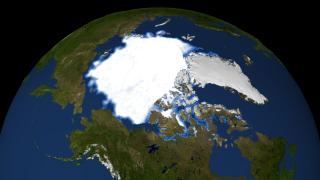
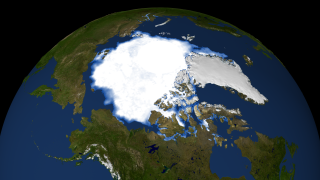
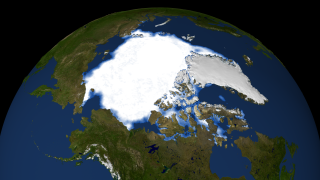
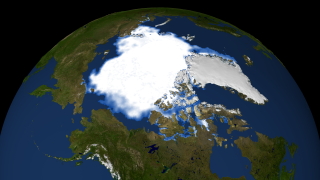
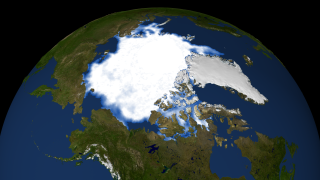
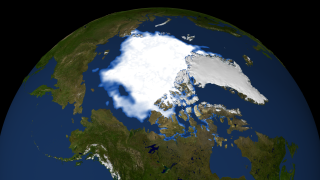
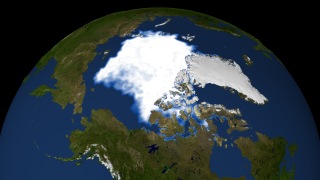
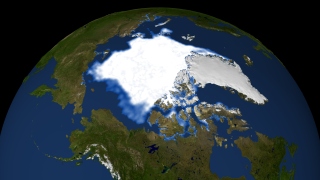
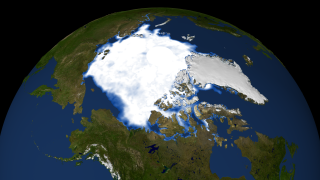
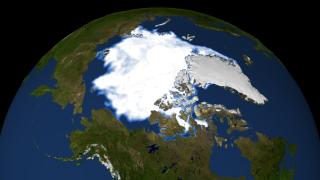
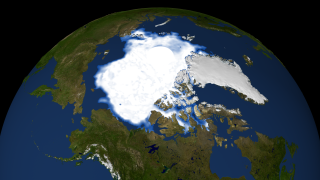
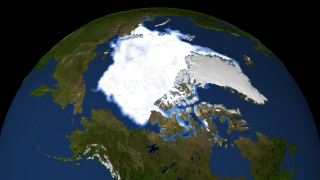
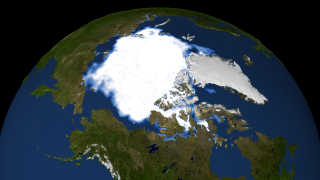
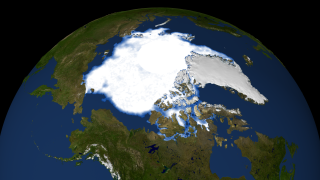
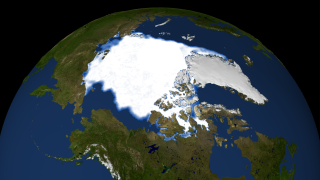
In 2007, Arctic summer sea ice reached its lowest extent on record - nearly 25% less than the previous low set in 2005. At the end of each summer, the sea ice cover reaches its minimum extent and what is left is what is called the perennial ice cover which consists mainly of thick multi-year ice floes. The area of the perennial ice has been steadily decreasing since the satellite record began in 1979, at a rate of about 10% per decade. But the 2007 minimum, reached on September 14, is far below the previous record made in 2005 and is about 38% lower than the climatological average. Such a dramatic loss has implications for ecology, climate and industry as new shipping lanes open.

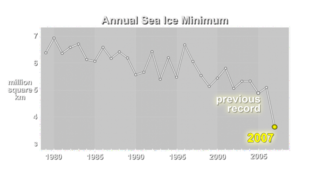
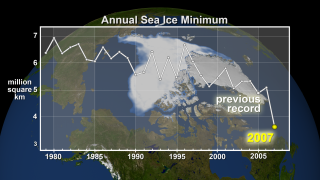
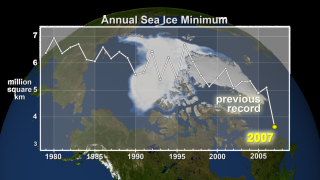
This visualization shows the annual Arctic sea ice minimum from 1979 to 2007. A graph is overlaid that shows the area in million square kilometers for each year's minimum day. The 'previous record' and the '2007' record are highlighted.


Annual Arctic sea ice minimum for 1979 to 2007    Annual Arctic sea ice minimum for 1979 to 2007
Duration: 24.0 seconds
Available formats:
  1280x720 (30 fps) MPEG-4   7 MB
  640x360 (30 fps) MPEG-4   2 MB
  512x288 (30 fps) MPEG-1   3 MB
  1280x720 (30 fps) MPEG-2   12 MB
  1280x720 (30 fps) Frames (Composite)
  1280x720 (30 fps) Frames (Dates overlay)
  1280x720 (30 fps) Frames (Ice)
  320x180     PNG           212 KB
  160x80       PNG           55 KB
  80x40         PNG           15 KB
How to play our movies


Overlay sequence: graph showing annual decline from 1979 to 2007    Overlay sequence: graph showing annual decline from 1979 to 2007

Available formats:
  1280x720 (30 fps) Frames (Graph overlay)
  320x180     PNG           153 KB
How to play our movies


Overlay still: Minimum Arctice sea ice area trend from 1979 to 2007    Overlay still: Minimum Arctice sea ice area trend from 1979 to 2007

Available formats:
  1280 x 720       TIFF 47 KB
  320 x 180         PNG   6 KB


Overlay still: average Arctic aea ice concentration (filled) from 1979 to 2007    Overlay still: average Arctic aea ice concentration (filled) from 1979 to 2007

Available formats:
  1280 x 720       TIFF 161 KB
  320 x 180         PNG 32 KB


Overlay still: average Arctic aea ice concentration (outline) from 1979 to 2007    Overlay still: average Arctic aea ice concentration (outline) from 1979 to 2007

Available formats:
  1280 x 720       TIFF 101 KB
  320 x 180         PNG 15 KB


Print resolution still showing the 14 Sept 2007 sea ice minimum record and an overlay graph showing previous years    Print resolution still showing the 14 Sept 2007 sea ice minimum record and an overlay graph showing previous years

Available formats:
  3840 x 2160     TIFF 7 MB
  3840 x 2160     JPEG 538 KB
  320 x 180         PNG 222 KB


14 September 2007 Arctic sea ice minimum area for 2007 (record minimum)    14 September 2007 Arctic sea ice minimum area for 2007 (record minimum)

Available formats:
  3840 x 2160     JPEG 517 KB
  3840 x 2160     TIFF 7 MB
  320 x 180         PNG 216 KB


14 September 2006 Arctic sea ice minimum area for 2006    14 September 2006 Arctic sea ice minimum area for 2006

Available formats:
  3840 x 2160     TIFF 7 MB
  320 x 180         PNG 211 KB


21 September 2005 Arctic sea ice minimum area for 2005    21 September 2005 Arctic sea ice minimum area for 2005

Available formats:
  3840 x 2160     TIFF 7 MB
  320 x 180         PNG 205 KB


11 September 2004 Arctic sea ice minimum area for 2004    11 September 2004 Arctic sea ice minimum area for 2004

Available formats:
  3840 x 2160     TIFF 7 MB
  320 x 180         PNG 210 KB


11 September 2003 Arctic sea ice minimum area for 2003    11 September 2003 Arctic sea ice minimum area for 2003

Available formats:
  3840 x 2160     TIFF 7 MB
  320 x 180         PNG 211 KB


12 September 2002 Arctic sea ice minimum area for 2002    12 September 2002 Arctic sea ice minimum area for 2002

Available formats:
  3840 x 2160     TIFF 7 MB
  320 x 180         PNG 210 KB


19 September 2001 Arctic sea ice minimum area for 2001    19 September 2001 Arctic sea ice minimum area for 2001

Available formats:
  3840 x 2160     TIFF 7 MB
  320 x 180         PNG 212 KB


11 September 2000 Arctic sea ice minimum area for 2000    11 September 2000 Arctic sea ice minimum area for 2000

Available formats:
  3840 x 2160     TIFF 7 MB
  320 x 180         PNG 211 KB


11 September 1999 Arctic sea ice minimum area for 1999    11 September 1999 Arctic sea ice minimum area for 1999

Available formats:
  3840 x 2160     TIFF 7 MB
  320 x 180         PNG 211 KB


12 September 1998 Arctic sea ice minimum area for 1998    12 September 1998 Arctic sea ice minimum area for 1998

Available formats:
  3840 x 2160     TIFF 7 MB
  320 x 180         PNG 212 KB


19 September 1997 Arctic sea ice minimum area for 1997    19 September 1997 Arctic sea ice minimum area for 1997

Available formats:
  3840 x 2160     TIFF 7 MB
  320 x 180         PNG 210 KB


10 September 1996 Arctic sea ice minimum area for 1996    10 September 1996 Arctic sea ice minimum area for 1996

Available formats:
  3840 x 2160     TIFF 7 MB
  320 x 180         PNG 211 KB


01 October 1995 Arctic sea ice minimum area for 1995    01 October 1995 Arctic sea ice minimum area for 1995

Available formats:
  3840 x 2160     TIFF 7 MB
  320 x 180         PNG 209 KB


05 September 1994 Arctic sea ice minimum area for 1994    05 September 1994 Arctic sea ice minimum area for 1994

Available formats:
  3840 x 2160     TIFF 7 MB
  320 x 180         PNG 212 KB


11 September 1993 Arctic sea ice minimum area for 1993    11 September 1993 Arctic sea ice minimum area for 1993

Available formats:
  3840 x 2160     TIFF 7 MB
  320 x 180         PNG 210 KB


04 September 1992 Arctic sea ice minimum area for 1992    04 September 1992 Arctic sea ice minimum area for 1992

Available formats:
  3840 x 2160     TIFF 7 MB
  320 x 180         PNG 209 KB


16 September 1991 Arctic sea ice minimum area for 1991    16 September 1991 Arctic sea ice minimum area for 1991

Available formats:
  3840 x 2160     TIFF 7 MB
  320 x 180         PNG 212 KB


19 September 1990 Arctic sea ice minimum area for 1990    19 September 1990 Arctic sea ice minimum area for 1990

Available formats:
  3840 x 2160     TIFF 7 MB
  320 x 180         PNG 210 KB


23 September 1989 Arctic sea ice minimum area for 1989    23 September 1989 Arctic sea ice minimum area for 1989

Available formats:
  3840 x 2160     TIFF 7 MB
  320 x 180         PNG 211 KB


12 September 1988 Arctic sea ice minimum area for 1988    12 September 1988 Arctic sea ice minimum area for 1988

Available formats:
  3840 x 2160     TIFF 7 MB
  320 x 180         PNG 213 KB


02 September 1987 Arctic sea ice minimum area for 1987    02 September 1987 Arctic sea ice minimum area for 1987

Available formats:
  3840 x 2160     TIFF 7 MB
  320 x 180         PNG 209 KB


06 September 1986 Arctic sea ice minimum area for 1986    06 September 1986 Arctic sea ice minimum area for 1986

Available formats:
  3840 x 2160     TIFF 7 MB
  320 x 180         PNG 209 KB


07 September 1985 Arctic sea ice minimum area for 1985    07 September 1985 Arctic sea ice minimum area for 1985

Available formats:
  3840 x 2160     TIFF 7 MB
  320 x 180         PNG 207 KB


16 September 1984 Arctic sea ice minimum area for 1984    16 September 1984 Arctic sea ice minimum area for 1984

Available formats:
  3840 x 2160     TIFF 7 MB
  320 x 180         PNG 208 KB


18 September 1983 Arctic sea ice minimum area for 1983    18 September 1983 Arctic sea ice minimum area for 1983

Available formats:
  3840 x 2160     TIFF 7 MB
  320 x 180         PNG 209 KB


17 September 1982 Arctic sea ice minimum area for 1982    17 September 1982 Arctic sea ice minimum area for 1982

Available formats:
  3840 x 2160     TIFF 7 MB
  320 x 180         PNG 208 KB


10 September 1981 Arctic sea ice minimum area for 1981    10 September 1981 Arctic sea ice minimum area for 1981

Available formats:
  3840 x 2160     TIFF 7 MB
  320 x 180         PNG 208 KB


05 September 1980 Arctic sea ice minimum area for 1980    05 September 1980 Arctic sea ice minimum area for 1980

Available formats:
  3840 x 2160     TIFF 7 MB
  320 x 180         PNG 210 KB


21 September 1979 Arctic sea ice minimum area for 1979    21 September 1979 Arctic sea ice minimum area for 1979

Available formats:
  3840 x 2160     TIFF 7 MB
  320 x 180         PNG 208 KB

Animation Number:3464
Animators:Greg Shirah (SVS) (Lead)
 Cindy Starr (SVS)
Completed:2007-09-24
Scientist:Josefino Comiso (NASA/GSFC)
Instrument:DMSP/SSMI
Data set:Comiso's September Minimum Sea Ice Concentration
Data Collected:1979 through 2007
Keywords:
DLESE >> Cryology
SVS >> HDTV
SVS >> Sea Ice
GCMD >> EARTH SCIENCE >> Cryosphere >> Sea Ice
GCMD >> EARTH SCIENCE >> Cryosphere >> Sea Ice >> Sea Ice Concentration
SVS >> iPod
 
 
Please give credit for this item to
NASA/Goddard Space Flight Center Scientific Visualization Studio
Thanks to Rob Gerston (GSFC) for providing the data.


Back to Top

USA.gov logo - the U.S. Government's official Web portal. + Privacy Policy and Important Notices
+ Reproduction Guidelines
NASA NASA Official:
SVS Contact:
Curator: