|
|
 |
Updated Jakobshavn Glacier Calving Front Retreat from 2001 through 2006 with Blue/White Elevation Change over Greenland
|
|
Since measurements of Jakobshavn Isbrae were first taken in 1850, the glacier gradually receded until about 1950, where it remained stable for the past 5 decades. However, from 1997 to 2006, the glacier has begun to recede again, this time almost doubling in speed. The finding is important for many reasons. As more ice moves from glaciers on land into the ocean, ocean sea levels raise. Jakobshavn Isbrae is Greenland's largest outlet glacier, draining 6.5 percent of Greenland's ice sheet area. The ice stream's speed-up and near-doubling of ice flow from land into the ocean has increased the rate of sea level rise by about .06 millimeters (about .002 inches) per year, or roughly 4 percent of the 20th century rate of sea level increase. This animation shows the glacier's flow in 2000, along with changes in the glacier's calving front between 2001 and 2006. This animation is an update of, and extension to, animation IDs #3374 and #3434. In this version, the pause on the approach to the Jakobshavn glacier where the meltwater lakes on the Greenland ice sheet are visible is shortened. In addition, the colors showing regions of elevation increase and decrease over the Greenland ice sheet are modified.
|
|

|
|
This animation shows the flow of the Jakobshavn glacier in 2000, followed by a time series of the glacier's retreat from 2001 through 2006. When pulling away from Greenland, a colored overlay shows the changes in the ice sheet elevation between 2003 and 2006.
Duration: 1.9 minutes
Available formats:
1280x720 (30 fps)
Frames
320x180
PNG
286 KB
160x80
PNG
66 KB
80x40
PNG
17 KB
512x288 (30 fps)
MPEG-1
38 MB
1280x720 (30 fps)
MPEG-2
159 MB
1280x720 (30 fps)
MPEG-4
95 MB
640x360 (30 fps)
MPEG-4
20 MB
How to play our movies
|
|
|
|
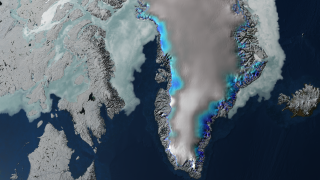
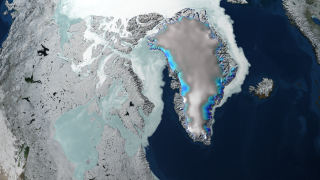
This image shows the elevation change over Greenland between 2003 and 2006.
Available formats:
3840 x 2160
TIFF
10 MB
320 x 180
PNG
290 KB
|
|
|
|
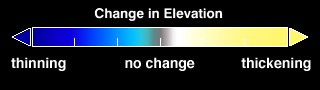
Color bar for the elevation change over Greenland.
Available formats:
320 x 90
PNG
7 KB
|
| Animation Number: | 3467 |
| Animators: | Cindy Starr (Lead) |
| | Greg Shirah |
| | Alex Kekesi |
| | Stuart A. Snodgrass |
| Studio: | NASA |
| Completed: | 2007-09-27 |
| Scientists: | Waleed Abdalati (NASA/GSFC) |
| | Richard Alley (Pennsylvania State University) |
| | Bob Bindschadler (NASA/GSFC) |
| | Jay Zwally (NASA/GSFC) |
| | Konrad Steffan (University of Colorado) |
| | Serdar Manizade (NASA/GSFC Wallops) |
| | Gordon Hamilton (University of Maine) |
| | Robert Thomas (NASA/GSFC-LARC) |
| | Ole Bennike (Geological Survey of Denmark and Greenland) |
| | Anker Weidick (Geological Survey of Denmark and Greenland) |
| Instruments: | Aqua/AMSR-E
|
| | ICESat/GLAS |
| | Landsat-7/ETM+ |
| | Terra/MODIS |
| Data sets: | Landsat-7 Band Combination 3, 2, 1
|
| | ICESat/GLAS Elevation |
| | Daily L3 6.25 km 89 GHz Brightness Temperature (Tb) |
| | AMSR-E Level 3 12.5 km Sea Ice Concentration |
| Data Collected: | MODIS imagery of Greenland (06/25/2003), Landsat Imagery (07/07/2001, 09/03/2002, 08/23/2003, 10/03/2004), ASTER Imagery(07/02/2005, 08/08/2006), MODIS Blue Marble Landcover, ICESat topography 2003 - 2006 |
Keywords:
DLESE
>> Cryology
SVS
>> HDTV
GCMD
>> EARTH SCIENCE
>> Cryosphere
GCMD
>> EARTH SCIENCE
>> Cryosphere
>> Sea Ice
GCMD
>> EARTH SCIENCE
>> Oceans
>> Sea Ice
GCMD
>> EARTH SCIENCE
>> Cryosphere
>> Sea Ice
>> Ice Extent
GCMD
>> EARTH SCIENCE
>> Cryosphere
>> Sea Ice
>> Ice Growth/Melt
GCMD
>> EARTH SCIENCE
>> Cryosphere
>> Sea Ice
>> Ice Types
GCMD
>> EARTH SCIENCE
>> Cryosphere
>> Sea Ice
>> Sea Ice Concentration
GCMD
>> EARTH SCIENCE
>> Cryosphere
>> Sea Ice
>> Sea Ice Motion
GCMD
>> EARTH SCIENCE
>> Cryosphere
>> Snow/Ice
>> Ice Extent
GCMD
>> EARTH SCIENCE
>> Cryosphere
>> Snow/Ice
>> Ice Motion
GCMD
>> EARTH SCIENCE
>> Hydrosphere
>> Snow/Ice
>> Ice Extent
GCMD
>> EARTH SCIENCE
>> Hydrosphere
>> Snow/Ice
>> Ice Motion
GCMD
>> EARTH SCIENCE
>> Oceans
>> Sea Ice
>> Ice Extent
SVS
>> iPod
|
|
Please give credit for this item to
NASA/Goddard Space Flight Center Scientific Visualization Studio
The Next Generation Blue Marble data is courtesy of Reto Stockli (NASA/GSFC). |
|
Back to Top
|
|
|
|

