Balancing Nutrition, Participation, and Cost in
the National School Lunch Program
Case studies have found
that schools can keep their budgets in the black
while serving nutritious lunches.
Constance
Newman
Katherine
Ralston
Annette
Clauson
|
|
|
|
Schools
face the dual constraints of meeting
nutrition requirements and covering
costs.
|
|
|
The
free-meal subsidy covers most of the
per meal cost, but the price paid by
most paying students covers only half
of the per meal cost. |
|
|
School
foodservice managers say that to appeal
to students and raise revenues, they
need to offer less nutritious a la
carte foods and vending snacks. |
|
| This
article is drawn from . . . |
|
The
National School Lunch Program: Background,
Issues, and Trends, by Katherine
Ralston, Constance Newman, Annette Clauson,
Joanne Guthrie, and Jean Buzby, ERR-61,
USDA, Economic Research Service, July 2008.
School
Lunch and Breakfast Cost Study – II,
Nutrition Assistance Program Report Series,
USDA, Food and Nutrition Service, April 2008.
|
| You
may also be interested in . . . |
|
Could
Behavioral Economics Help Improve Diet
Quality for Nutrition Assistance Program
Participants? by
David R. Just, Lisa Mancino, and Brian
Wansink, ERR-43, USDA, Economic Research
Service, June 2007. |
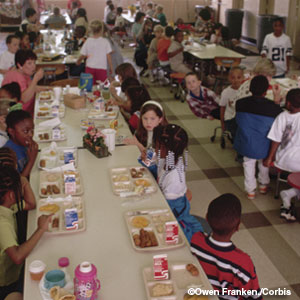
The National School Lunch Program
(NSLP) provides federally subsidized meals to more
than 30 million children each school day. Recently,
reported high rates of obesity and overweight among
children have focused attention on the nutritional
quality of school lunches. But this attention has
raised another fundamental question: Can schools
meet the program’s nutrition goals while
covering costs, especially in times of rising food
prices?
School districts are responsible for providing
school meals. They receive a per meal subsidy and
free agricultural commodities from USDA to help
operate school lunch programs. Schools also get
revenues from NSLP meal sales to students who are
not eligible for free meals. The costs of running
the program can exceed these two revenue sources,
and schools often turn to other funding or food
sales to make up the difference. For many schools,
calls to raise nutrition standards could mean higher
costs. Some schools say that to satisfy students
and keep up revenues, they may need to offer foods
of lower nutritional quality.
While
nationally representative data are not available,
several case studies have found that schools can
keep their budgets in the black while still serving
nutritious lunches. Some have succeeded by reducing
costs, and others have raised revenues through
increased student participation. And schools have
found creative ways to make healthy food appealing
to students. Federal nutrition guidelines, meal
reimbursement, and commodity donations can help
schools meet their objectives, although variation
in food prices and nutrition goals present added
challenges.
USDA Provides Per Meal
Subsidies and Commodities
The
National School Lunch Program Feeds More
Children in a Day Than McDonald’s |
The NSLP operated in over
101,000 public and nonprofit private schools
in 2007.
Schools participating in
the NSLP served over 5 billion lunches to
more than 30 million children in 2007.
Of the 30 million students
served in 2007, 15 million students qualified
for free lunches, 3 million students paid
a reduced price, and 12 million students
paid full price. Children from families with
incomes below 130 percent of the poverty
level are eligible for free meals. Those
with incomes between 130 and 185 percent
of the poverty level are eligible for reduced-priced
meals.
Federal Government contributions
to the NSLP were $8.7 billion in 2007, with
$7.7 billion in cash payments and $1.04 billion
in commodity donations.
|
USDA
support is intended to cover much of the cost of
providing NSLP lunches, and most of it is in the
form of cash reimbursement for meals served. In
2007-08, USDA reimbursed schools $2.47 for each
free lunch served, $2.07 for each reduced-price
lunch, and $0.23 for each paid lunch (see box, “The
National School Lunch Program Feeds More Children
in a Day Than McDonald’s”). Basic
Federal reimbursement rates are the same for all
school districts across the country except in Hawaii
and Alaska, which have higher rates to compensate
for higher food prices in those States. Rates are
also 2 cents more in districts where at least 60
percent of school meals are served free or at a
reduced price. Reimbursement rates are adjusted
by the Consumer Price Index for Food Away from
Home for Urban Consumers once a year for inflation.
USDA also donates commodities to States to use
in school lunches. In FY 2007, the commodities
given to schools were worth 17 cents per meal for
a total of $1.04 billion. Donation amounts vary
per year, depending on availability and prices.
States select from a wide variety of foods (including
fruit and vegetables), based on what school food
authorities need for their planned menus. The 2002
farm bill directed that USDA spend $200 million
of entitlement funds for fruit and vegetables from
2002 through 2007, and the 2008 farm bill increased
that amount to $406 million by 2012. In addition
to the basic “entitlement” commodities, “bonus” commodities
are sometimes available through USDA’s price
support and surplus removal programs.
The Fresh Fruit and Vegetable Snack Program is
another program designed to increase fruit and
vegetable availability to schools. Federal dollars
are used directly by schools to purchase fresh
fruit and vegetables for snacks. The 2008 farm
bill called for a gradual expansion of this program
to all States by 2012 and a total expenditure of
$1 billion.
Schools Face Nutrition and Cost Constraints
School
food authorities (SFAs) face the dual constraints
of meeting Federal nutrition requirements and covering
operating costs. In many cases, SFAs must meet
State and local nutrition requirements that are
more stringent than Federal standards.
Federal law requires that NSLP
lunches provide one-third of the Recommended Dietary
Allowances for protein, vitamin A, vitamin C, iron,
calcium, and calories. Schools can use a food-based
meal pattern, in which certain types of foods must
be served, or use a nutrient-based meal pattern
that requires an entree and side dish that meet
the nutrient regulations. Schools must offer a
variety of milk with every meal, and this can be
some combination of whole, 2-percent, 1-percent,
skim, or flavored milk. Since 1996, Federal standards
require that no more than 30 percent of meal calories
can come from total fat and 10 percent from saturated
fat when averaged over the school week.
States and local school districts, however, have
been instituting their own stricter standards for
years. In 2004, Congress called on SFAs to develop
a “Local Wellness Policy,” which would
set goals for nutrition standards and physical
activity. An estimated 33 States have instituted
additional standards for school foods. Some States
call for the complete removal of non-NSLP foods
from cafeterias or campuses, while others restrict
the times when non-NSLP foods are available.
Cost
pressures present a challenge to improving the
school food environment. The costs of producing
school meals are rising, driven partly by higher
health care costs for employees and recently by
increasing food costs. Although Federal reimbursement
rates are adjusted for inflation, some observers
question whether the rates accurately track
cost increases.
Report
Card: Do NSLP Lunches Make the Grade?
Studies show that students who get the NSLP meal
have higher intakes of key nutrients (such as vitamins
A, C, B6, folate, thiamin, iron, and phosphorus)
than children who bring their lunches from home
or buy a la carte items. Studies found that NSLP
participants consume more milk and vegetables and
fewer sweets, sweetened beverages, and snack foods
than nonparticipants do at lunch, and the same
trend holds for milk, vegetables, and candy over
a 24-hour period.
In one study, NSLP participants were found to consume
more calcium, fiber, fruits, and 100-percent juices,
both at lunch and over 24 hours. The difference
in intake between participants and nonparticipants
was largest for calcium and was probably due to
higher milk consumption for participants—about
half a serving on average. The fact that differences
were maintained over 24 hours indicates improvement
in the overall daily diet,
as opposed to improvement only at
the lunch meal and counteracted at
other meals.
Studies of nutrient intake also show similar calorie
intake for participants and nonparticipants but
higher fat and sodium intake for participants.
Whether the higher fat intake extends to weight
gain is not clear: One study shows no effect of
school meal participation on children’s obesity,
and another study shows that NSLP
participants have a 2-percentage-point higher probability
of obesity.
Despite
Federal regulations, many NSLP lunches do not actually
meet fat and nutrient requirements. The most recently
available data, the 2005 School Nutrition Dietary
Assessment (SNDA), showed improvement in saturated
fat content from the 1998-99 SNDA, but it found
that only one in four elementary schools served
lunches that met the standard for fat and one in
three met the standard for saturated fat. For high
schools, the numbers were even lower: 1 in 10 for
fat and 1 in 5 for saturated fat.
The Free-Meal Subsidy Covers Most, but Not All,
Costs
In 2005-06, USDA’s Food and Nutrition Service
(FNS) sponsored a national study—the School
Lunch and Breakfast Cost Study II—to evaluate
the adequacy of reimbursements. The study measured
cost in two ways: the reported cost and the full
cost of producing a
reimbursable or nonreimbursable meal.
Reported
costs are those incurred by SFAs in providing meals;
these costs are charged to their foodservice accounts.
Full costs are the reported costs plus
unreported costs that the school districts, not
the SFAs, incur on behalf of the program. Unreported
costs can include meal-time supervisory labor,
administrative labor, such as that needed for payroll
and accounting, as well as indirect costs, such
as those associated with equipment and utility
costs that are not charged to the SFA. In school
year 2005-06, full costs were composed of food
(37 percent), labor (about 48 percent), and other
costs (about 15 percent), which included supplies,
contract services, and indirect costs.
The FNS cost study found that in school year 2005-06,
the average reported cost for producing a reimbursable
lunch was $2.36 across SFAs. Summing the cash reimbursement
for free lunches from that year ($2.32 and $2.34
for qualifying low income districts) and the entitlement
commodity rate for that year ($0.175), the midpoint
reimbursement rate was $2.51, which was higher
than the average reported cost. Most schools had
costs below the reimbursement rate: 78 percent
of schools had reported per lunch costs that were
below the USDA free-lunch subsidy rate.
On
the other hand, in school year 2005-06, the average
full cost for producing a reimbursable lunch was
$2.91 across SFAs, which is 40 cents higher than
the midpoint free subsidy of $2.51. Only 32 percent
of schools had full lunch costs that were below
the USDA free-lunch subsidy. The finding that full
costs are generally not covered by the free-meal
rate points to the larger problem of hidden or,
perhaps, unanticipated costs that can affect the
long-term financial health of the program.
Schools with a larger share of students receiving
free or reduced-price meals were likely to cover
both types of costs. In schools where more than
60 percent of lunches served were free or reduced-price,
revenues averaged 125 percent of reported costs
and 107 percent of full costs. By contrast, in
schools with less than 60 percent of free and reduced-price
lunches served, revenues averaged 111 percent of
reported costs and 88 percent of full costs. The
greater amount of Federal subsidies received for
those meals makes an important difference to schools
in covering their costs.
Schools Turn to Competitive Foods for Revenues
Revenues for school meal programs come from various
sources: USDA subsidies, student payments for NSLP
meals, sales of other foods, and State and local
funds. According to the FNS cost study, 45 percent
of revenues for the average SFA came from per meal
reimbursements in 2005-06; 5 percent from commodity
donations; 24 percent from student payments for
NSLP meals; 16 percent from other food sales; and
10 percent from local and State government funds
and other cash revenues. The sales of other foods
have become a flash point for SFAs: The foods are
less nutritious in general and yet their sales
are considered necessary by many SFAs for financial
survival.
These
other foods, known as “competitive” or “nonreimbursable” foods,
can include a wide variety of foods available at
or near schools, including a la carte items sold
in the cafeteria and snacks sold in vending machines.
Vending machines were in 98 percent of senior high
schools, 97 percent of middle/junior high schools,
and 27 percent of elementary schools in 2004-05.
A la carte items were available for sale in 75
percent of elementary schools and over 90 percent
of middle and high schools.
Competitive foods are generally lower in key nutrients
and higher in fat than the NSLP reimbursable meal.
USDA requires only that “foods of minimal
nutritional value” not be sold in foodservice
areas during mealtimes. However, this requirement
covers a limited number of foods, a small area
of the school, and a short part of the day. The
availability of competitive foods in a school has
been found to reduce participation in NSLP, decrease
nutrient intake from lunches, and increase the
amount of food left uneaten and thrown away by
students. The availability of unhealthy foods also
sends a mixed message to students about the importance
of nutrition.
Surprisingly,
FNS’s
cost study finds that the revenues from nonreimbursable
food sales do not cover their costs on
average. Revenues from nonreimbursable foods covered
less of their costs (both full and reported costs)
than was the case for NSLP lunches. Revenues from
NSLP lunches covered 93 percent of their full costs,
compared with 61 percent for nonreimbursable meals.
For reported costs, revenue from NSLP lunches covered
115 percent of costs versus 71 percent for nonreimbursable
meals. Perhaps nonreimbursable sales serve other
purposes for schools—such as attracting more
students to the cafeteria. Or the costs incurred
in selling nonreimbursable foods may be difficult
to accurately separate from costs for reimbursable
foods. The study assigns labor costs proportionately
to the costs of nonreimbursable and reimbursable
foods, and this may explain why the costs for nonreimbursable
foods seem higher
than expected.
Building a Healthy School Lunch Program
The available evidence, while limited, suggests
that nutrition and financial health do not have
to conflict. A study of SFAs in Minnesota found
that meal costs were not higher for cafeterias
that met regulations for nutritional quality than
for those that did not. Some, but not all, SFAs
in a pilot study in California were able to improve
nutritional quality while continuing to break even.
According
to the case studies, schools have found ways to
lower costs and increase revenues. Some SFAs have
switched to part-time labor with lower health care
benefits, some buy more food in bulk, and some
use more ready-to-eat foods. In some cases, SFAs
have outsourced meal provision to private foodservice
management companies. Schools have joined purchasing
cooperatives to reduce food costs, and a small
but increasing number of schools are purchasing
directly from local farmers. As of May 2008, 1,929
school districts have an operational “farm-to-school” program,
according to the National Farm to
School network.
Schools have also found creative ways to increase
revenues through higher student participation.
Most of these strategies have revolved around food
preparation changes, lunch scheduling changes,
and nutrition education. Smaller efforts have brought
students into the process of tasting, selecting,
and learning about nutrition through games and
parties. Some schools have completely revamped
their lunch programs, while others have implemented
more gradual changes (see box, “New
Ideas From School Kitchens”).
Studies
have identified several supporting factors as necessary
complements to lunch program changes. First, eliminating
or greatly reducing competitive foods has been
essential. Students eat more healthful foods and
purchase more NSLP meals when their options are
reduced. Second, school lunch programs can benefit
from buy-in from all stakeholders: superintendents,
principals, school foodservice personnel, parents,
and students. Efforts to improve nutritional quality
have proven successful when everyone is onboard,
and particularly when leadership
is energetic.
The
economics of providing school meals needs to be
further investigated, especially in light of recent
food and fuel price increases. The 2005-06 FNS
cost study is the only study that provides national
estimates of the revenues and costs of school lunch
operations, and it provides important insights.
Contrary to conventional wisdom, the findings
suggest that competitive foods are not especially
profitable for school food
services. Instead, the study suggests that financial
solvency is likely to be gained via the most profitable
component, the NSLP meals themselves. In FY 2008,
62 percent of public and private school students
received or purchased an NSLP meal on an average
day, so there is room to expand participation.
Serving additional meals raises revenues while
spreading the cost of the cafeteria and other fixed
costs over more meals.
Another
way to increase revenues is for schools to raise
the prices charged to students for full and reduced-price
NSLP lunches and other foods. According to the
SNDA study, in 2004-05, most SFAs charged $1.50
for a full-price NSLP meal and $0.40 for a reduced-price
meal. The full price charged to students was significantly
lower than the average full cost to produce that
meal of $2.91. The gap between prices for paid
lunches and full costs helps explain why SFAs with
lower rates of free and reduced-price meal participation
are vulnerable to deficits.
SFAs historically have been reluctant
to raise prices because their main goal as nonprofits
is to serve affordable meals. In practical terms,
SFAs face the need to balance the increased revenues
from a price increase against potential losses
from the reduction in meals purchased as a result
of the higher price. Little is known of the tradeoffs
between higher prices and demand for lunches for
most schools.
When
schools have needed the significant capital investment
to completely overhaul their lunch programs, they
have largely turned to their communities for funding.
This may be an area where the Federal Government
could assist further, as it has in the past when
funds were needed to equip school cafeterias.
A
clear way to increase revenues
relative to costs is to get more students to join
the lunch line. Following the lead of successful
schools, an important change is to offer freshly
made, healthful meals that students help to choose
and that they have time to enjoy. Whether this
is accomplished by completely revamping the program,
by making it more efficient, or by raising prices
charged to paying
students, schools have shown that
providing quality, nutritional meals
can be done, and it can lead to higher
participation rather than lower.
New Ideas From School Kitchens |
| Schools have successfully implemented a
wide range of changes in their lunch rooms,
from dramatic changes to small tweaks.
Many have substantially modified their lunch
programs by remodeling their kitchens and
serving areas and, in some cases, by hiring
new foodservice directors. Kitchen renovations
can provide needed space for fresh food preparation,
storage, and new serving areas, such as salad
bars, which are typically popular with students.
The Berkeley Unified School District in Berkeley,
CA, as part of a public/private partnership
called the School Lunch Initiative, has upgraded
school kitchens to better handle fresh food
and reheat meals made from scratch in a central
kitchen. They now have a salad bar in each
school; they serve fresh fruits and vegetables
daily, and they give priority to locally
produced, organic food.
New management can also make a difference.
In 2003, Hopkins School District in Minneapolis,
MN, hired a new foodservice director with
professional foodservice management experience.
The initial changes made by the new director
were small: Healthy foods were made available
as an option and the soda vending machine
contract was canceled. After the community
approved a bond initiative, more major changes
were made: Meals were prepared completely
onsite and fresh, low-fat, and whole-grain
foods became the only options. Food costs
rose, and they charged more for the meal
to paying students, but the director was
able to keep labor and other non-food costs
down to where they had been before the change.
Also, students were not allowed to go off
campus to buy other food.
Smaller innovations at other schools have
included bringing students into the food
selection process through tastings and demonstration
events. Schools have used marketing-style
promotions, games, and parties to highlight
different new foods. Wolftrap Elementary
in Vienna, VA, sponsors monthly “tasting
parties,” where students are asked
to rate different versions of a healthy entree
or snack. Student participation provides
the unique perspective that an adult may
completely miss, such as whether the food
is too messy to eat or whether it can get
caught in one’s braces. And schools
get student buy-in as they move to more nutritious
meal options.
Other successful strategies have included
changes to the cafeteria environment—longer
lunch periods, shorter lunch lines, and pleasant
seating areas. Studies have found that, when
students have more time to eat and especially
when lunch follows recess, they are more
likely to eat all of their lunch and thus
more likely to eat a balanced meal. Also,
when the cafeteria is designed to reduce
time in lunch lines, students spend more
time eating. Schools have also found that
students eat well when there are nice seating
areas that are conducive
to socializing.
For
more information, see . . .
Making
It Happen! School Nutrition Success Stories,
FNS-374, USDA, Food and Nutrition Service,
U.S. Health and Human Services, Centers
for Disease Control and Prevention, and
U.S. Department of Education, January 2005.
|
|