|
« Factbook Table of
Contents
4. Disease Statistics
- Deaths From All Causes and Deaths
From Cardiovascular, Lung, and Blood Diseases, U.S., 1984 and 2004
- Deaths From Specific Cardiovascular,
Lung, and Blood Diseases, U.S., 2004
- Death Rates for Cardiovascular and
Noncardiovascular Diseases, U.S., 1963, 1985, and 2005
- Deaths Under Age 1 Year Due to
Cardiovascular and Lung Diseases, U.S., 2005
- Prevalence of Common Cardiovascular
and Lung Diseases, U.S., 2005
- Direct and Indirect Economic Costs
of Illness by Major Diagnosis, U.S., 2007
Cardiovascular, lung, and blood diseases constitute a
large morbidity, mortality, and economic burden on individuals, families, and
the Nation. Common forms are atherosclerosis, hypertension, COPD, and
blood-clotting disorders—embolisms and thromboses. The most serious
atherosclerotic diseases are CHD, as manifested by heart attack and angina
pectoris, and cerebrovascular disease, as manifested by stroke.
In 2004, cardiovascular, lung, and blood diseases
accounted for 1,093,000 deaths and 46 percent of all deaths in the United
States (p. 31). The projected economic cost in 2008 for these diseases is
expected to be $623 billion, 23 percent of the total economic costs of illness,
injuries, and death (p. 47). Of all diseases, heart disease is the
leading cause of death, cerebrovascular disease is third (behind cancer), and
COPD (including asthma) ranks fourth (p. 34). Cardiovascular and lung
diseases account for 3 of the 4 leading causes of death (p. 34) and 4 of the 10
leading causes of infant death (p. 40). Hypertension, heart disease,
asthma, and COPD are especially prevalent and account for substantial morbidity
in Americans (p. 43).
The purpose of the biomedical research conducted by
the NHLBI is to contribute to the prevention and treatment of cardiovascular,
lung, and blood diseases and sleep disorders. National disease statistics
show that by midcentury, morbidity and mortality from these diseases had
reached record high levels. Since then, however, substantial improvements
have been achieved, especially over the past 40 years, as shown by the
significant decline in mortality rates. Because many of these diseases
begin early in life, their early detection and control can reduce the risk of
disability and can delay death. Although important advances have been
made in the treatment and control of cardiovascular, lung, and blood diseases,
these diseases continue to be a major burden on the Nation.
Mortality statistics in this chapter are for diseases
or conditions classified as the underlying cause of death. Heart failure,
however, is never truly an underlying cause even though 57,120 deaths in 2004
were nominally coded to it as the underlying cause. Therefore, in this
chapter, mortality statistics attributed to heart failure represent it as
either the underlying cause or a contributing cause of death.
The 2004 mortality statistics in this Fact Book are
final counts. They differ from the 2004 mortality statistics presented in
the FY 2006 Fact Book because those statistics were preliminary (though not
stated).
Cardiovascular Diseases
- In 2004, CVD caused 870,000 deaths—36 percent
of all deaths (p. 31).
- Heart disease is the leading cause of death; the
main form, CHD, caused 452,000 deaths in 2004 (pp. 32, 34).
- The annual number of deaths from CVD increased
substantially between 1900 and 1970 and remains high (p. 33).
- The death rate (not age-adjusted) for CVD increased
from 1920 until it peaked in 1968. Since then, the trend has been
downward. In 2005, the rate was similar to the rate in the 1920s (p.
33).
- Cerebrovascular disease, the third leading cause of
death, accounted for 150,000 deaths in 2004 (pp. 32, 34).
- Heart disease is second only to all cancers
combined in years of potential life lost (p. 34).
- Heart disease is the leading cause of death in
blacks, Hispanics, and American Indians, but second to cancer in Asians.
Stroke ranks as the third or fourth leading cause of death in the minority
groups, except in American Indians, where it ranks sixth (p. 34).
- Between 1970 and 2004, the increase in deaths with
heart failure as the underlying or contributing cause is a major exception to
the mortality decline in CVD (p. 35).
- Between 1985 and 2004, death rates for heart
disease and stroke declined in men and women of all racial/ethnic groups.
Declines in death rates for heart disease were steepest in whites (p. 36).
- Because of the rapid decline in mortality from CHD
since the peak in 1968, there were 1,036,000 fewer deaths from CHD in 2005 than
would have occurred if there had been no decline (p. 37).
- Substantial improvements have been made in the
treatment of CVD. Since 1975 or 1985, case-fatality rates from
hospitalized AMI, stroke, heart failure, and cardiac dysrhythmia declined
appreciably (p. 37).
- The decline in CHD mortality began earlier in the
United States than in most countries and outpaced that in most countries until
the 1990s (only selected countries are shown) (p. 38).
- Between 1999 and 2005, the percent decline in death
rates for CHD and stroke was slightly greater for whites than for blacks (p.
39).
- In 2005, an estimated 80.7 million persons in the
United States had some form of CVD, 73 million had hypertension, and 16 million
had CHD (p. 43).
- Since the 1960s, there has been a substantial
reduction in the prevalence of CVD risk factors: hypertension, smoking, and
high cholesterol, but not overweight. The decline in prevalence of
hypertension from 1976–80 to 1988–94 was followed by an increase in
1999–2004 (p. 44).
- Between 1976–80 and 1999–2004, the
percent of persons with hypertension who were aware of their condition, on
treatment for it, and having their blood pressure under control increased
substantially (p. 45).
- A 1999–2004 national survey showed only about
40 percent of hypertensive patients (systolic BP ≥ 140 mm Hg or diastolic
BP ≥ 90 mm Hg or on antihypertensive medication) had their condition
under control (p. 40).
- Hospitalization rates for heart failure increased
between 1971 and 2005 (p. 46).
- The estimated economic cost of CVD for 2008 is
approximately $448 billion:
- $296 billion in direct health expenditures
- $38 billion in indirect cost of morbidity
- $114 billion in indirect cost of mortality (p.
47).
Lung Diseases
- Lung diseases, excluding lung cancer, caused an
estimated 227,000 deaths in 2004 (p. 31).
- COPD caused 118,000 deaths in 2004 and is the
fourth leading cause of death (pp. 32, 34).
- Between 1999 and 2005, death rates for COPD and
asthma decreased in both black and white men and women, with one
exception: the COPD death rate increased slightly in white women (p.
39).
- Between 1980 and 2005, infant death rates for
various lung diseases declined markedly (p. 39).
- Of the 10 leading causes of infant mortality, 4 are
lung diseases or have a lung disease component (p. 40). Between 1995 and
2005, changes in mortality for the causes were:
- Congenital anomalies (-14 percent)
- Disorders of short gestation (2 percent)
- Sudden infant death syndrome (-45
percent)
- Respiratory distress syndrome (-40
percent).
- One in five deaths in children under 1 year of age
is due to a lung disease (p. 40).
- Between 1980 and 2000, the COPD death rate for
women in the United States is increasing significantly compared with the rates
in several other countries (p. 41).
- Between 1985 and 2004, death rates for COPD
increased for women in all racial/ethnic groups except Asian. For men,
the rates decreased in all racial/ethnic groups except American Indians (p.
42).
- Sleep disorders are increasingly being recognized
as an important health problem. The number of physician office visits for
sleep apnea, restless legs syndrome, and narcolepsy increased from 1 million in
1990 to 7 million in 2005 (p. 42).
- Asthma is a common chronic condition, particularly
in children (pp. 43, 44, 46).
- The economic cost of lung diseases is expected to
be $160 billion in 2008—$99 billion in direct health expenditures and $60
billion in indirect cost of morbidity and mortality (p. 47).
Blood Diseases
- An estimated 223,000 deaths, 9 percent of all
deaths, were attributed to blood diseases in 2004 (p. 31). These include
the following:
- 214,000 due to blood-clotting disorders
- 9,000 to diseases of the red blood cell and
bleeding disorders (p. 32).
- A large proportion of deaths from AMI and
cerebrovascular disease involve blood-clotting problems (p. 32).
- In 2008, blood-clotting disorders are expected to
cost the Nation’s economy $105 billion, and other blood diseases will cost
$14 billion (p. 47).
Deaths From All Causes and Deaths
From Cardiovascular, Lung, and Blood Diseases, U.S., 1984 and 2004
| Cause of Death |
1984 Number of Deaths |
1984 Percent of Total |
2004 Number of Deaths |
2004 Percent of Total |
| All Causes |
2,039,000 |
100 |
2,398,000 |
100 |
|
All Cardiovascular, Lung, and
Blood Diseases |
1,149,000 |
56 |
1,093,000 |
46 |
|
Cardiovascular
Diseases |
984,000 |
48 |
870,000 |
36 |
|
Blood |
319,000* |
16 |
223,000** |
9 |
|
Lung |
169,000† |
8 |
227,000‡ |
9 |
| All Other Causes |
890,000 |
44 |
1,305,000 |
54 |
|
Deaths
by Major Causes, U.S., 2004 |
Deaths
From Cardiovascular, Lung, and Blood Diseases, U.S., 2004 |
Text-only with data
points |
Text-only with data
points |
*Excludes 13,000 deaths from
pulmonary heart disease (0.5%).
**Excludes 214,000 deaths from
blood-clotting disorders (8.9%). |
* CVD involving blood clotting
(24.6%). |
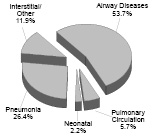
Deaths From Specific
Cardiovascular, Lung, and Blood Diseases, U.S., 2004
| Cause of Death |
Cardiovascular
Deaths (Thousands) |
Lung
Deaths (Thousands) |
Blood
Deaths (Thousands) |
| Acute
Myocardial Infarction |
157 |
— |
107* |
| Other
Coronary Heart Disease |
295 |
— |
— |
|
Cerebrovascular Diseases (Stroke) |
150 |
— |
95* |
| Other
Atherosclerosis |
36 |
— |
4* |
| Pulmonary
Embolism |
8 |
8* |
8* |
| Other
Cardiovascular Diseases |
224 |
5* |
— |
| Bleeding
and Red Blood Cell Diseases |
— |
— |
9 |
| Chronic
Obstructive Pulmonary Disease**
|
— |
118 |
— |
| Asthma |
— |
4 |
— |
| Other
Airway Diseases |
— |
0 |
— |
|
Pneumonia |
— |
60 |
— |
| Neonatal
Pulmonary Disorders |
— |
5 |
— |
|
Interstitial Lung Diseases |
— |
5 |
— |
| Lung
Diseases Due to External Agents |
— |
18 |
— |
| Other Lung
Diseases |
— |
4 |
— |
|
Total |
870 |
227 |
223 |
Deaths From Cardiovascular Diseases, U.S., 2004
Note: Numbers may not sum to 100 percent due to
rounding.
Source: Estimated by the NHLBI from Vital Statistics of the United
States, NCHS.
Deaths From Cardiovascular Diseases, U.S.,
1900–2005*
*Data for 2005 are preliminary.
Source: Vital
Statistics of the United States, NCHS.
Death Rates* for Cardiovascular Diseases, U.S.,
1900–2005**
*Not age-adjusted.
**Data for 2005 are
preliminary.
Source: Vital Statistics of the United States, NCHS.
Ten Leading Causes of Death: Death Rates, U.S.,
2005*
*Data for 2005 are preliminary.
* *Includes 149.8
deaths per 100,000 population from CHD.
† COPD and allied conditions
(including asthma); the term in the ICD/10 is "chronic lower respiratory
diseases."
‡ Based on the average remaining years of life up to age 77
years.
Note: Diseases shown in bold (Heart Disease, Stroke, COPD) are those
addressed in Institute programs.
Source: Vital Statistics of the United
States, NCHS.
Ten Leading Causes of Death Among Minority Groups,
U.S., 2004
* Includes deaths among individuals of Asian
extraction and Asian-Pacific Islanders.
** Includes deaths among Aleuts and
Eskimos.
Note: Diseases shown in bold (Heart, Stroke, COPD) are those
addressed in Institute programs.
Source: Vital Statistics of the United
States, NCHS.
Death Rates* for Cardiovascular and
Noncardiovascular Diseases, U.S., 1963, 1985, and 2005
| Cause of Death |
Deaths/100,000 Population |
Percent Change 1963-2005 |
Percent Change 1985-2005 |
| 1963 |
1984 |
2005 |
| All Causes |
1,346 |
988 |
799 |
-41 |
-19 |
|
Cardiovascular
Diseases |
805 |
481 |
278 |
-65 |
-42 |
|
Coronary Heart
Disease |
478 |
260 |
144 |
-70 |
-45 |
|
Stroke |
174 |
80** |
47 |
-73 |
-42 |
|
Other |
153 |
140 |
87 |
-43 |
-37 |
|
Noncardiovascular
Diseases |
541 |
507 |
521 |
-4 |
3 |
|
COPD and Asthma |
16 |
36† |
43 |
162 |
20 |
|
Other |
524 |
471 |
478 |
-9 |
1 |
* Heart failure as the underlying or
contributing cause of death.
Note: Breaks in trend line indicate
change in ICD codes.
Source: Vital Statistics of the United States,
NCHS.
Age-Adjusted Death Rates for Heart Disease by
Race/Ethnicity and Sex, U.S., 1985–2004
Text-only with data
points |
*Non-Hispanic.
Note: Each line is a log linear
regression derived from the actual rates.
Source: Vital Statistics of the
United States, NCHS. |
Age-Adjusted Death Rates for Stroke by Race/Ethnicity
and Sex, U.S., 1985–2004

Text-only with data
points |
*Non-Hispanic.
Note: Each line is a log linear
regression derived from the actual rates.
Source: Vital Statistics of the
United States, NCHS. |
Age-Adjusted Death Rates for Coronary Heart Disease,
U.S., 1950–2005*
Actual Rate and Expected Rates if Rise Had
Continued or Reached a Plateau
*Data for 2005 are preliminary.
Source: Vital
Statistics of the United States, NCHS.
Common Cardiovascular and Lung Diseases With High
Percentage Discharged Dead From Hospitals, U.S., 1975, 1985, and 2005
Source: National Hospital Discharge Survey, NCHS.
Death Rates* for Coronary Heart Disease in Men, Ages
35–74, in Selected Countries, 1970–2004
* Age-adjusted to the European Standard
Population.
Source: World Heath Statistics Annual, World Health
Organization (WHO).
Death Rates* for Coronary Heart Disease in Women,
Ages 35–74, in Selected Countries, 1970–2004
* Age-adjusted to the European Standard
Population.
Source: World Heath Statistics Annual, WHO.
Percent Change in Age-Adjusted Death Rates for
Selected Causes by Race and Sex, U.S., 1999–2005*
* Data for 2005 are preliminary.
Source: Vital Statistics of the United States, NCHS.
Death Rates for Lung Diseases in Infants, U.S.,
1980–2005*
* Data for 2005 are preliminary.
Source: Vital Statistics of the United States, NCHS.
Ten Leading Causes of Infant Mortality, U.S.,
2005
* Data for 2005 are
preliminary.
** Congenital CVD and congenital respiratory
diseases accounted for 53.7 deaths under age 1 per 100,000 live births (black
bar), which is 40 percent of infant deaths due to all congenital anomalies.
† Between 1995 and 2005, congenital CVD
declined 31 percent; congenital anomalies of the respiratory system declined 15
percent; other congenital anomalies increased 2 percent.
NA: Not
available.
Note: Diseases shown in bold are those addressed in
Institute programs.
Source: Vital Statistics of the United States,
NCHS.
Deaths Under Age 1 Year Due to
Cardiovascular and Lung Diseases, U.S., 2005*
| Cause of Death |
Deaths Under Age 1 |
Text-only with
data points |
| All Causes |
27,936 |
| Cardiovascular Diseases |
2,239 |
|
|
1,646 |
|
Other |
593 |
|
Lung Diseases |
5,335 |
|
Sudden Infant Death
Syndrome |
2,246 |
|
Respiratory Distress
Syndrome |
875 |
|
Pneumonia |
273 |
|
Bronchopulmonary Dysplasia
(BPD) |
239 |
|
Atelectasis of
Newborn |
419 |
|
Congenital
Anomalies |
580 |
|
Other Lung Diseases
|
703 |
| Other Diseases |
20,362 |
* Data for 2005 are preliminary.
Note: Diseases shown in bold (Cardiovascular Disease, Sudden Infant
Death Syndrome, Respiratory Distress Syndrome, Congenital Anomalies), are those
addressed in Institute programs.
Source: Vital Statistics of the
United States, NCHS.
Death Rates* for Chronic Obstructive Pulmonary
Disease in Men, Ages 35 and Older, in Selected Countries, 1980–2004
* Age-adjusted to the European Standard
Population.
Source: World Health Statistics Annual, WHO.
Death Rates* for Chronic Obstructive
Pulmonary Disease in Women, Ages 35 and Older, in Selected Countries,
1980–2004
* Age-adjusted to the European Standard
Population.
Source: World Health Statistics Annual, WHO.
Age-Adjusted Death Rates for Chronic Obstructive
Pulmonary Disease by Race/Ethnicity and Sex, U.S., 1985–2004
* Non-Hispanic.
Note: Each line
is a log linear regression derived from the actual rates. Rates from
1985–1998 are modified by the ICD revision comparability ratio.
Source: Vital Statistics of the United States, NCHS.
Physician Office Visits for Sleep Disorders, U.S.,
1990–2005
Note: Primary and secondary
diagnoses.
Source: National Ambulatory Medical Care Survey, NCHS.
Prevalence of Common
Cardiovascular and Lung Diseases, U.S., 2005
|
Disease |
Number |
|
Cardiovascular Diseases* |
80,700,000 |
|
Hypertension** |
73,000,000 |
|
Coronary Heart Disease |
16,800,000 |
|
Heart Failure |
5,300,000 |
|
Stroke |
5,800,000 |
|
Congenital Heart Disease† |
1,000,000 |
|
Asthma‡ |
22,000,000 |
|
COPD§ |
24,000,000 |
* Hypertension, CHD,
cerebrovascular disease, or heart failure. Hypertension is defined as
systolic blood pressure > 140 mm Hg, or diastolic blood pressure
> 90, or being on antihypertensive medication.
Source:
NHANES, 1999–2004 extrapolated to U.S., 2004.
Prevalence of Common Cardiovascular and Lung Diseases
by Age, U.S., 2004
Source: NHIS and NHANES.
Age-Adjusted Prevalence of Cardiovascular Disease
Risk Factors in Adults, U.S., 1961–2004
Note: Hypertension is defined as systolic blood
pressure > 140 mm Hg, or diastolic blood pressure is > 90
mm Hg, or being on antihypertensive medication. High cholesterol is
240+ mg/dl. Overweight is BMI 25+ kg/m2.
Sources:
NHIS for smoking, ages ≥18 and NHANES for the other risk factors, ages
20–74.
Hypertensive* Population Aware, Treated, and
Controlled, Ages 18 and Older, U.S., 1976–1980 to 1999–2004
* Hypertension is defined as
systolic blood pressure ≥ 140 mm Hg, or diastolic blood pressure
> 90 mm Hg, or being on antihypertensive medication.
Source: NHANES, NCHS.
Adult Population With Hypertension* by Age,
Race/Ethnicity, and Sex, U.S., 1999–2004
* Hypertension is systolic
blood pressure ≥ 140 mm Hg, diastolic blood pressure ≥ 90 mm Hg, or
being on antihypertensive medication.
** Non-Hispanic.
Sources: NHANES and NCHS.
Hospitalization Rates for Heart Failure, Ages
45–64 and 65 and Older, U.S., 1971–2005
Source: National Hospital Discharge Survey,
NCHS.
Persons Experiencing Asthma Episodes in Previous 12
Months by Age, U.S., 1997–2006
Source: NHIS, NCHS.
Direct and Indirect Economic Costs
of Illness by Major Diagnosis, U.S., 2007
| |
Amount (Dollars in Billions) |
Percent Distribution |
| |
Indirect Costs |
Indirect Costs |
| |
Direct Costs* |
Morbidity** |
Mortality† |
Total |
Direct Costs |
Morbidity |
Mortality |
Total |
| Cardiovascular
Disease |
$ 296.4 |
$ 37.6 |
$114.5 |
$ 448.5 |
15.3% |
17.0% |
20.4% |
16.5% |
|
(including Blood Clotting)‡ |
(69.6) |
(8.3) |
(26.7) |
(104.6) |
(3.6) |
(3.7) |
(4.8) |
(3.8) |
| Lung
Diseases§ |
99.4 |
28.9 |
31.5 |
159.8 |
5.1 |
13.0 |
5.6 |
5.9 |
| Blood Diseases |
10.6 |
0.7 |
3.0 |
14.3 |
0.5 |
0.3 |
0.5 |
0.5 |
|
Subtotal, Cardiovascular, Lung, Blood Diseases |
406.4 |
67.2 |
149.0 |
622.6 |
20.9 |
30.3 |
26.5 |
22.9 |
| Diseases of the
Digestive System |
209.3 |
11.4 |
25.5 |
246.2 |
10.8 |
5.1 |
4.5 |
9.0 |
| Neoplasms |
93.2 |
18.8 |
116.1 |
228.1 |
4.8 |
8.5 |
20.7 |
8.4 |
| Mental Disorders |
165.6 |
29.2 |
9.6 |
204.4 |
8.5 |
13.2 |
1.7 |
7.5 |
| Diseases of the Nervous
System |
147.5 |
8.7 |
13.0 |
169.2 |
7.6 |
3.9 |
2.3 |
6.2 |
| Diseases of the
Musculoskeletal System |
116.7 |
22.6 |
2.9 |
142.2 |
6.0 |
10.2 |
0.5 |
5.2 |
| Diseases of the
Genitourinary System |
87.3 |
5.8 |
6.9 |
100.0 |
4.5 |
2.6 |
1.2 |
3.7 |
| Endocrine, Nutritional,
and Metabolic Diseases |
80.6 |
7.2 |
20.5 |
108.3 |
4.2 |
3.2 |
3.7 |
4.0 |
| Infectious and
Parasitic Diseases |
41.6 |
13.5 |
26.6 |
81.7 |
2.1 |
6.1 |
4.7 |
3.0 |
| Diseases of the
Skin |
46.5 |
1.6 |
0.7 |
48.8 |
2.4 |
0.7 |
0.1 |
1.8 |
| Other and Unallocated
to Diseases |
546.6 |
35.5 |
190.5 |
772.6 |
28.2 |
16.0 |
33.9 |
28.4 |
| Total |
$1,941.3 |
$221.5 |
$561.3 |
$2,724.1 |
100% |
100% |
100% |
100% |
* Direct costs are personal
health care expenditures for hospital and nursing home care, drugs, home care,
and physician and other professional services. The estimation method is
based on Centers for Medicare & Medicaid Services (CMS) projections for
total 2008 health expenditures by type of direct costs and NCHS estimates of
direct costs in 1995 for each of the major diagnostic groups. The
proportion of costs for 1995 for each diagnostic group is applied to the
equivalent 2008 total by type of direct cost.
** Morbidity costs
were estimated for 2008 by multiplying NCHS estimates for 1980 by a
1980–2008 percent inflation factor derived from the increase in mean
earnings estimated by the Bureau of the Census.
† The mortality cost for each disease group was
estimated for 2008 by first multiplying the number of deaths in 2004 in each
age- and sex-specific group by the 2003 value of lifetime earnings (latest
available) discounted at 3 percent; second, summing these estimates for each
diagnostic group; and third, multiplying the estimates by a 2003–2008
inflation factor (1.14) based on change in mean earnings.
‡ Costs of blood clotting disease are
estimated from predetermined proportions of CVD morbidity and mortality
statistics for MI, cerebrovascular diseases, and diseases of arteries.
§ Does not include lung cancer or leukemia.
Note: Numbers may not add to totals due to rounding.
Sources: Estimates
by the NHLBI; data from the NCHS, the CMS, the Bureau of the Census, and the
Institute for Health and Aging, University of California,
« Factbook Table of
Contents |