|
|
CHART 6.2
|
Employment as a percent of the working-age population
for persons with disabilities and persons without disabilities
|
- Persons reporting disabilities were much less likely to be employed than persons without disabilities.
- More than half of the working-age population reporting disabilities were employed in Norway, Canada, and Sweden. In contrast, less than one-third were employed in Spain and Italy.
Text only
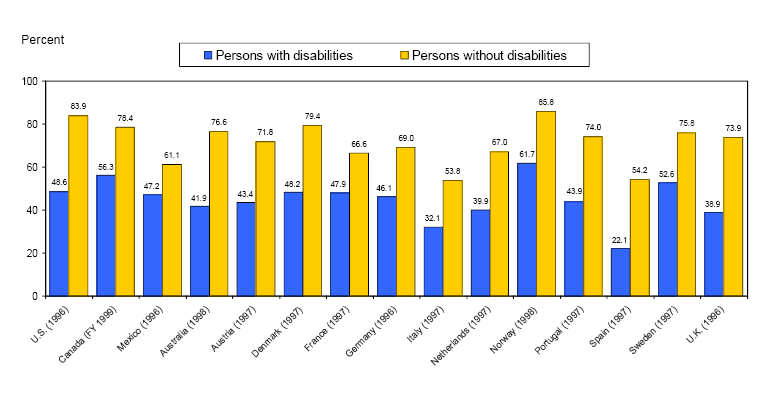
NOTE: The working-age population for each reference group is defined as persons ages 20 to 64.
SOURCE: Organization for Economic Cooperation and Development.
|