
|
||
|
|
||
| View other datasets |
|
|
| ||
 |
|||
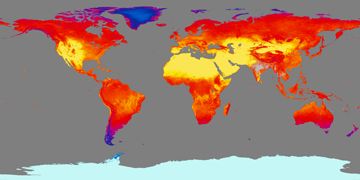
| Coverage of this dataset spans February 2000 to July 2006. | |||
The animation features of the Earth Observatory are currently unavailable. We apologize for the inconvenience. To view the full temporal span of this dataset, please view the Day Land Temperature monthly holdings. | |||
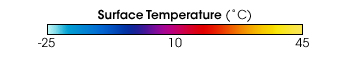 Product description: Land surface temperature is a good indicator of the energy balance at the Earth�s surface, and serves as an important indicator of the greenhouse effect. Land surface temperature is the sum of all the comings and goings of energy between the ground and the atmosphere, and as such, it can reveal quite a bit about surface conditions. That makes LST essential for a wide variety of climatic, hydrologic, ecological and biogeochemical studies. Land surface temperature can be used for evaluating water requirements of crops, for determining frost-damaged areas in orange groves, and for assessing the impact of climate change on the Arctic, an environment that will be particularly sensitive to rising global temperatures. The Moderate Resolution Imaging Spectroradiometer (MODIS) on NASA’s Terra and Aqua satellites take the temperature of every square kilometer of the Earth nearly every day, barring cloudy skies. MODIS senses the temperature of all natural and man-made land surfaces--everything from snow to deserts, from rooftops to treetops. The map above shows daytime LST for the month indicated. (Nighttime LST values are available as well.) Values range from 250 to 320 Kelvin (about -23 to 47 degrees Celsius, or -10 to 116 degrees Fahrenheit) in shades from light blue to yellow. Visualizations by Reto Stockli, Earth Observatory, based on data provided by the MODIS Science Team, NASA Goddard Space Flight Center
|
|
Subscribe to the Earth Observatory About the Earth Observatory Contact Us Privacy Policy and Important Notices Responsible NASA Official: Lorraine A. Remer Webmaster: Goran Halusa We're a part of the Science Mission Directorate |