|
July 9, 2002
Measuring Earthshine: How New Terra Data are Improving Weather and Climate
Forecast Models
A sensor aboard NASA’s Terra satellite is helping scientists map how
much sunlight the Earth’s surface reflects back up into the atmosphere,
and this new detailed information should help to greatly improve weather and
forecast models.
The Moderate Resolution Imaging Spectroradiometer (MODIS) now routinely
provides daily global and local measurements of albedo, or the total amount of
light reflected from Earth’s surface out to space. These precise data may
allow scientists to better understand and predict how various surface features
absorb and reflect solar radiation, which influence both short-term weather
patterns and longer-term climate trends.
In a May 2002 issue of Geophysical Research Letters, a team of scientists at
Boston University reported that the new albedo measurements match up well with
the wide variance of geological features found across the Earth’s barren
landscapes.
“Zooming in on Africa’s Sahara Desert and the Arabian Peninsula,
for instance, MODIS observed considerable variability in reflectance across the
region—from the darkest volcanic terrains to the brightest sand sheets,”
said Elena Tsvetsinskaya, the paper’s lead author and a researcher at
Boston University. “So we can relate specific soil groups and rock types
to MODIS-derived albedo measurements.”
This correlation is important because most current weather forecast models
treat this region as if the surface is uniform and therefore reflects the same
amount of light all across its wide expanse. However, the terrain across the
Sahara Desert and Arabian Peninsula is actually quite varied. Darker surface
features (like rocks and plant canopies) absorb more light than lighter surfaces
(like sand) and therefore get hotter in the afternoon. Over the course of a day,
these heating differences can set up atmospheric motions that influence clouds
and rain.
By coupling the MODIS measurements with geologic information, Tsvetsinskaya
and her colleagues have provided weather and climate modelers with a new map of
albedo across Northern Africa and the Arabian Peninsula that they can use to
fine-tune their models. The team classified the region into eight categories,
each of which has a distinct reflectivity range.
“There is a certain scientific beauty in deriving albedos from
something else in the model (such as geologic information),” said Robert
Dickinson, project lead at the Georgia Institute of Technology. “But the
more practical reason is for ‘what if’ studies. For example, what if the
wind in Africa blew so hard it covered all the black rocks with white
sand?”
This scenario hints at what both meteorologists and climate researchers alike
know well: albedo for a given region can change relatively quickly. For example,
the bright white snow- and ice-covered landscapes of Canada and Siberia during
the winter and early spring reflect most incoming solar radiation back up into
space, thereby helping to keep the surface cold.
But as the snow melts with the gradual onset of summer, the boreal forest
canopy is exposed to the sunlight. The vegetated surface is much darker and
strongly absorbs light, which helps to warm the surface.
NASA scientists discovered recently that once the snow melts in the
Earth’s boreal regions, densely-vegetated surfaces begin to release a
significant amount of heat into the overlying atmosphere. Yufang Jin, a Boston
University graduate student, uses MODIS albedo data to document the difference
between snow covered and snow-free vegetated surfaces in a related paper in
another May issue of Geophysical Research Letters.
Over the longer term, regular MODIS albedo measurements will allow scientists
to monitor how the Earth’s reflectivity changes on a global scale.
“This will help us determine how the Earth’s climate is changing,
both globally and locally,” said Crystal Schaaf, co-author and research
professor at Boston University. “When humans convert a vegetated region to
a more reflective surface type (such as an urban area), the albedo
changes.”
Similarly, Schaaf added, when places like the grasslands of the African Sahel
contract, they leave more reflective, barren deserts, which increases albedo.
Launched December 18, 1999, Terra is the flagship of the Earth Observing
System series of satellites and a central part of NASA’s Earth Science
Enterprise. The mission of the Earth Science Enterprise is to develop a
scientific understanding of the Earth system and its response to natural and
human-induced changes to enable improved prediction capability for climate,
weather, and natural hazards. |
|

The MODIS instrument, flying aboard NASA’s Terra and Aqua
satellites, measures how much solar radiation is reflected by the Earth’s
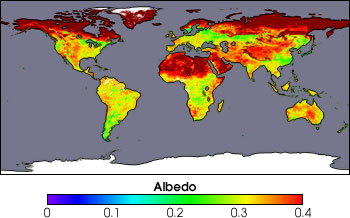
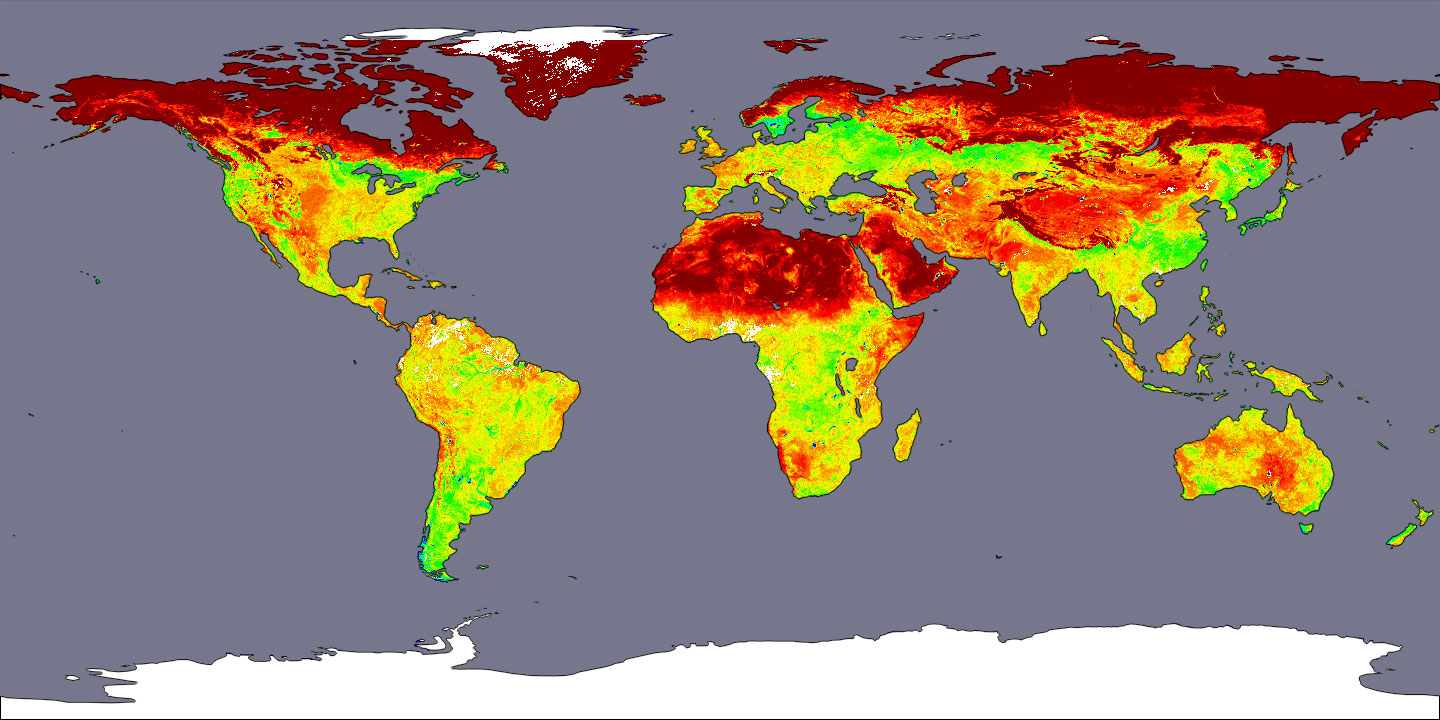
surface almost every day over the entire planet. The colors in this image
emphasize the albedos ranging from 0.0 to 0.4 over the Earth’s land surfaces.
Areas colored red show the brightest, most reflective regions; yellows and
greens are intermediate values; and blues and violets show relatively dark
surfaces. White indicates no data were available, and no albedo data are provided
over the oceans. This image was produced using data composited over a 16-day period, from April 7-22, 2002. (Image courtesy Crystal Schaaf, Boston University)
large images & animations:
high resolution (230 KB JPEG)
print quality (590 KB TIFF)
small animation (1.7 MB MPEG)
full-size animation (5.7 MB MPEG)
uncompressed NTSC animation (70 MB Quicktime)

The new MODIS albedo data product reveals in striking detail
how widely varied the terrain is across Northern Africa and the Arabian
Peninsula. The variation across the land’s surface affects how much solar
radiation is absorbed and how much is reflected back up into the overlying
atmosphere. This new data product should significantly improve weather forecast
models for that region. This image was produced using data composited over a 16-day period, from April 7-22, 2002. (Image courtesy Elena Tsvetsinskaya, Boston University)
large images & animations:
high resolution (840 KB JPEG)
print quality (4.0 MB TIFF)
small animation (1.4 MB MPEG)
full-size animation (4.7 MB MPEG)
uncompressed NTSC animation (109 MB Quicktime)
|

