|
March 2, 2005
SATELLITE SEES OCEAN PLANTS INCREASE, COASTS GREENING
A few years ago, NASA researcher Watson Gregg published a study showing that tiny free-floating ocean plants called phytoplankton had declined
in abundance globally by 6 percent between the 1980s and 1990s. A new study by Gregg and his co-authors suggests that trend may not be continuing,
and new patterns are taking place.
Why is this important? Well, the tiny ocean plants help regulate our atmosphere and the health of our oceans. Phytoplankton produce half of the
oxygen generated by plants on Earth. They also can soften the impacts of climate change by absorbing carbon dioxide, a heat-trapping greenhouse gas.
In addition, phytoplankton serve as the base of the ocean food chain, so their abundance determines the overall health of ocean ecosystems. Given
their importance, it makes sense that scientists would want to closely track trends in phytoplankton numbers and in how they are distributed around
the world.
Gregg and his colleagues published their new study in a recent issue of Geophysical Research Letters. The researchers used NASA satellite data
from 1998 to 2003 to show that phytoplankton amounts have increased globally by more than 4 percent. These increases have mainly occurred along the
coasts. No significant changes were seen in phytoplankton concentrations within the global open oceans, but phytoplankton levels declined in areas
near the center of the oceans, the mid-ocean gyres. Mid-ocean gyres are “ocean deserts”, which can only support low amounts of
phytoplankton. When viewed by satellite, these phytoplankton-deprived regions look deep-blue, while in aquatic regions where plant life thrives, the
water appears greener.
“The ocean deserts are getting bluer and the coasts are getting greener,” said Gregg, an oceanographer at NASA’s Goddard Space
Flight Center (GSFC), Greenbelt, Md. “The study suggests there may be changes occurring in the biology of the oceans, especially in the coast
regions.”
Phytoplankton amounts have increased by 10.4 percent along global coast regions, where the ocean floor is less than 200 meters (656 feet) deep.
Ocean plant life has greened the most in the Patagonian Shelf and the Bering Sea, and along the coasts of the Eastern Pacific Ocean, Southwest
Africa, and near Somalia. Both the Patagonian Shelf and the California/Mexican Shelf showed large increases in phytoplankton concentrations of over
60 percent.
Meanwhile, the researchers observed declines in phytoplankton amounts in five mid-ocean gyres over the six-year study period, including the North
and South Atlantic, and North and South Pacific oceans, and a possible new gyre region in the North Central Indian ocean. At the same time, for all
but the North Atlantic gyre, sea surface temperatures increased in at least one season.
“In the mid-ocean gyres, the downward trends in phytoplankton concentrations do appear related to mid-ocean sea surface temperatures,”
said Gregg.
Phytoplankton growth is largely dependent on amounts of nutrients and light available to the plants. Warmer water temperatures can create distinct
layers in the ocean surface, which allows less of the nutrient-rich, colder deeper water to rise up and mix with sunny surface layers where
phytoplankton live. Winds churn and mix the ocean water, carrying nutrient-rich waters to the sunny surface layer, so when winds decline mixing
declines, and phytoplankton can suffer.
In a number of open ocean regions, increases in phytoplankton levels countered the declines found in the gyres and other areas. For example, a 72
percent increase in phytoplankton abundance occurred in the Barents Sea. The researchers observed a smaller 17 percent increase in phytoplankton
amounts in the Western Central Pacific near Indonesia and the Philippines. The waters cooled in the Western Pacific, while wind stresses increased by
26 percent over the study period. The cooling water and increasing winds are consistent with climate conditions that lead to greater mixing of
water.
The six full years of data used in this analysis came from NASA’s Sea-viewing Wide Field-of-view Sensor (SeaWiFS), which detects ocean
colors. Chlorophyll is the substance or pigment in plants that appears green and captures energy from sunlight. The sunlight, along with carbon
dioxide and water, are processed by the phytoplankton to form carbohydrates for building cells. SeaWiFS measures this greenness. While the study
refers to the measurement of chlorophyll a concentrations in the ocean, researchers use the measures of chlorophyll a to estimate amounts of
phytoplankton.
While declines in phytoplankton abundance in mid-ocean gyres appear related to warming oceans, a number of factors requiring more study to may be
contributing to the coastal increases in plant life.
“We don’t know the causes of these coastal increases,” said Gregg. “The trends could indicate improved health of the
ecosystems as a whole, or they could be a sign of nutrient stress.” Causes of nutrient stress include land run-off that deposits agricultural
fertilizers and other nutrients in the oceans. The run-off can promote large algal blooms that can deplete the water of oxygen.
Gregg and coauthors caution that the length of time the data cover is too short to answer questions about long term trends, but for the time being
the phytoplankton declines in the global oceans observed between the 1980s and 1990s appear to have subsided.
Co-authors on the study include Nancy Casey of Science Systems Applications, Inc., who works at NASA GSFC, and Charles McClain, also a researcher
at NASA GSFC.
###
Contact:
Krishna Ramanujan
Goddard Space Flight Center
(607) 273-2561
krishna_ramanujan@ssaihq.com
|
|

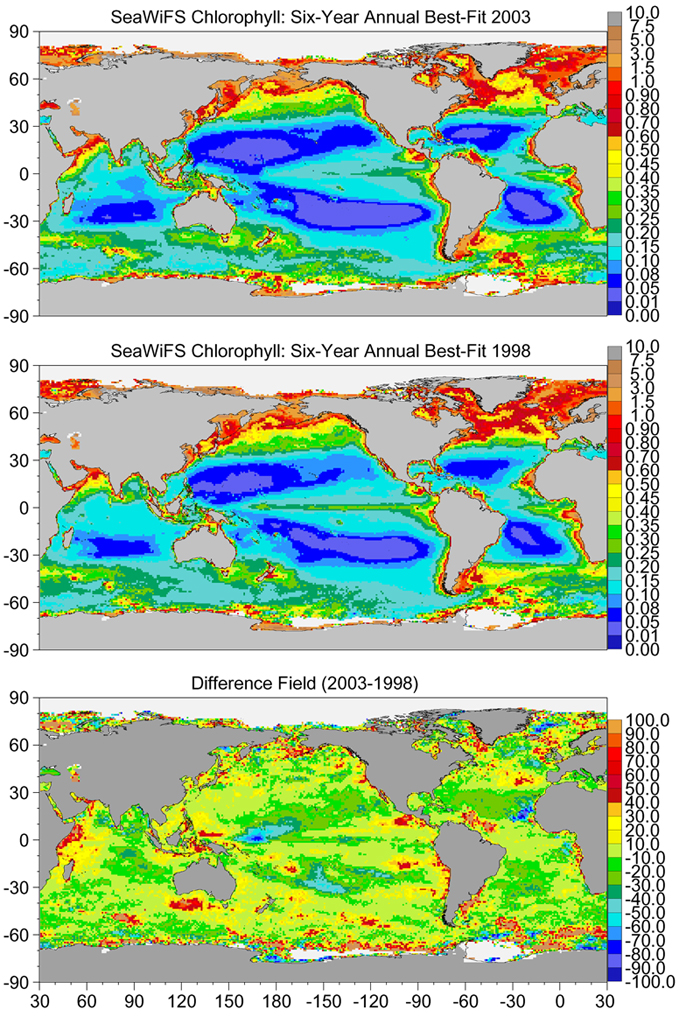
Satellites See Chlorophyll for 1998, 2003 and the Difference Between Them
Satellite trends of chlorophyll for 6 years from 1998-2003 were analyzed. The bottom panel depicts the trend in chlorophyll between 2003 and 1998,
shown as a percent difference. Many of the areas showing an increasing trend appear along the coasts, in red, while most of the dark blue areas
indicate a decreasing trend. Units for the top two panels are milligrams of chlorophyll per cubic meter.Credit: NASA (Gregg et al.)
High-Resolution Image

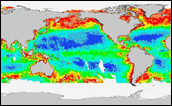
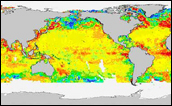
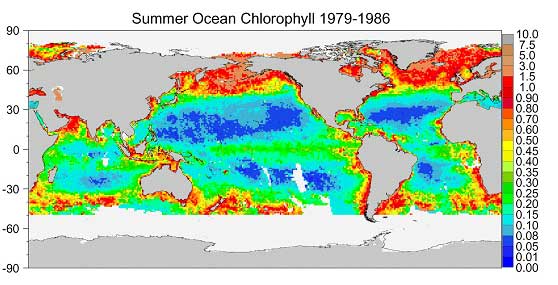
Decadal Changes in Ocean Chlorophyll
These maps show changes in the amounts of ocean chlorophyll between the 1980s and 1990s. They were developed with satellite, buoy and ship data.
Top Image: Nimbus 7 satellite data (July to September) from 1979 to 1986 used. Ocean color reflects varying concentrations of chlorophyll that absorb
different levels of sunlight. Reds show high concentrations of chlorophyll, yellow represents medium concentrations, green is the next rung down and
blue is low. Middle Image: SeaWiFS satellite data during the summers (July to Sept.) from 1997 to 2000. Bottom Image: The differences in ocean
chlorophyll between the SeaWIFS and Nimbus 7 datasets. Credit: NASA, (Gregg) and NOAA (Conkright)
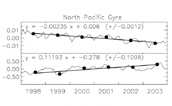
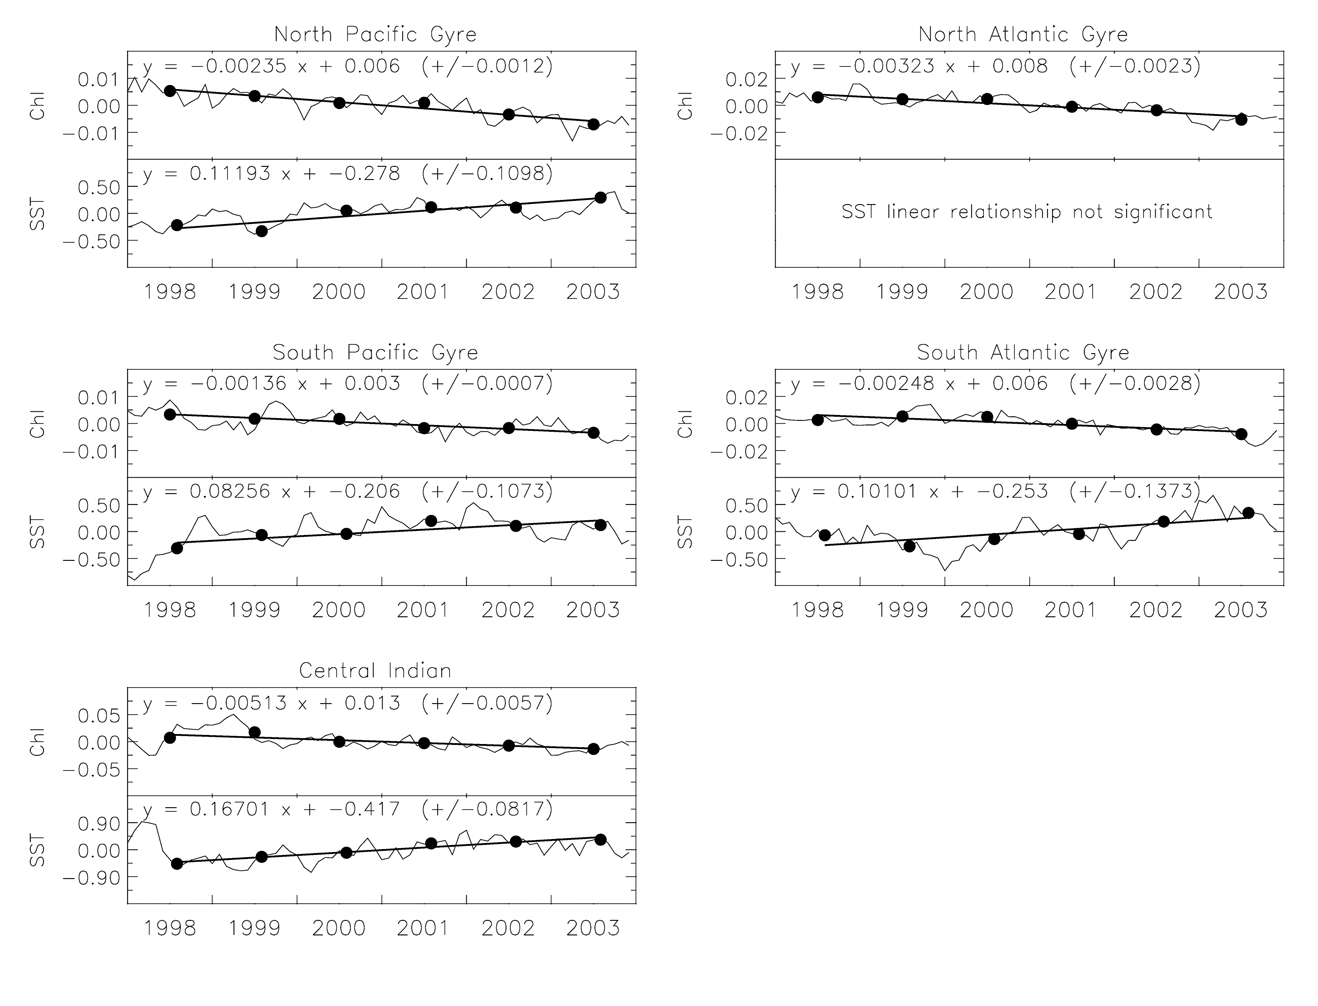
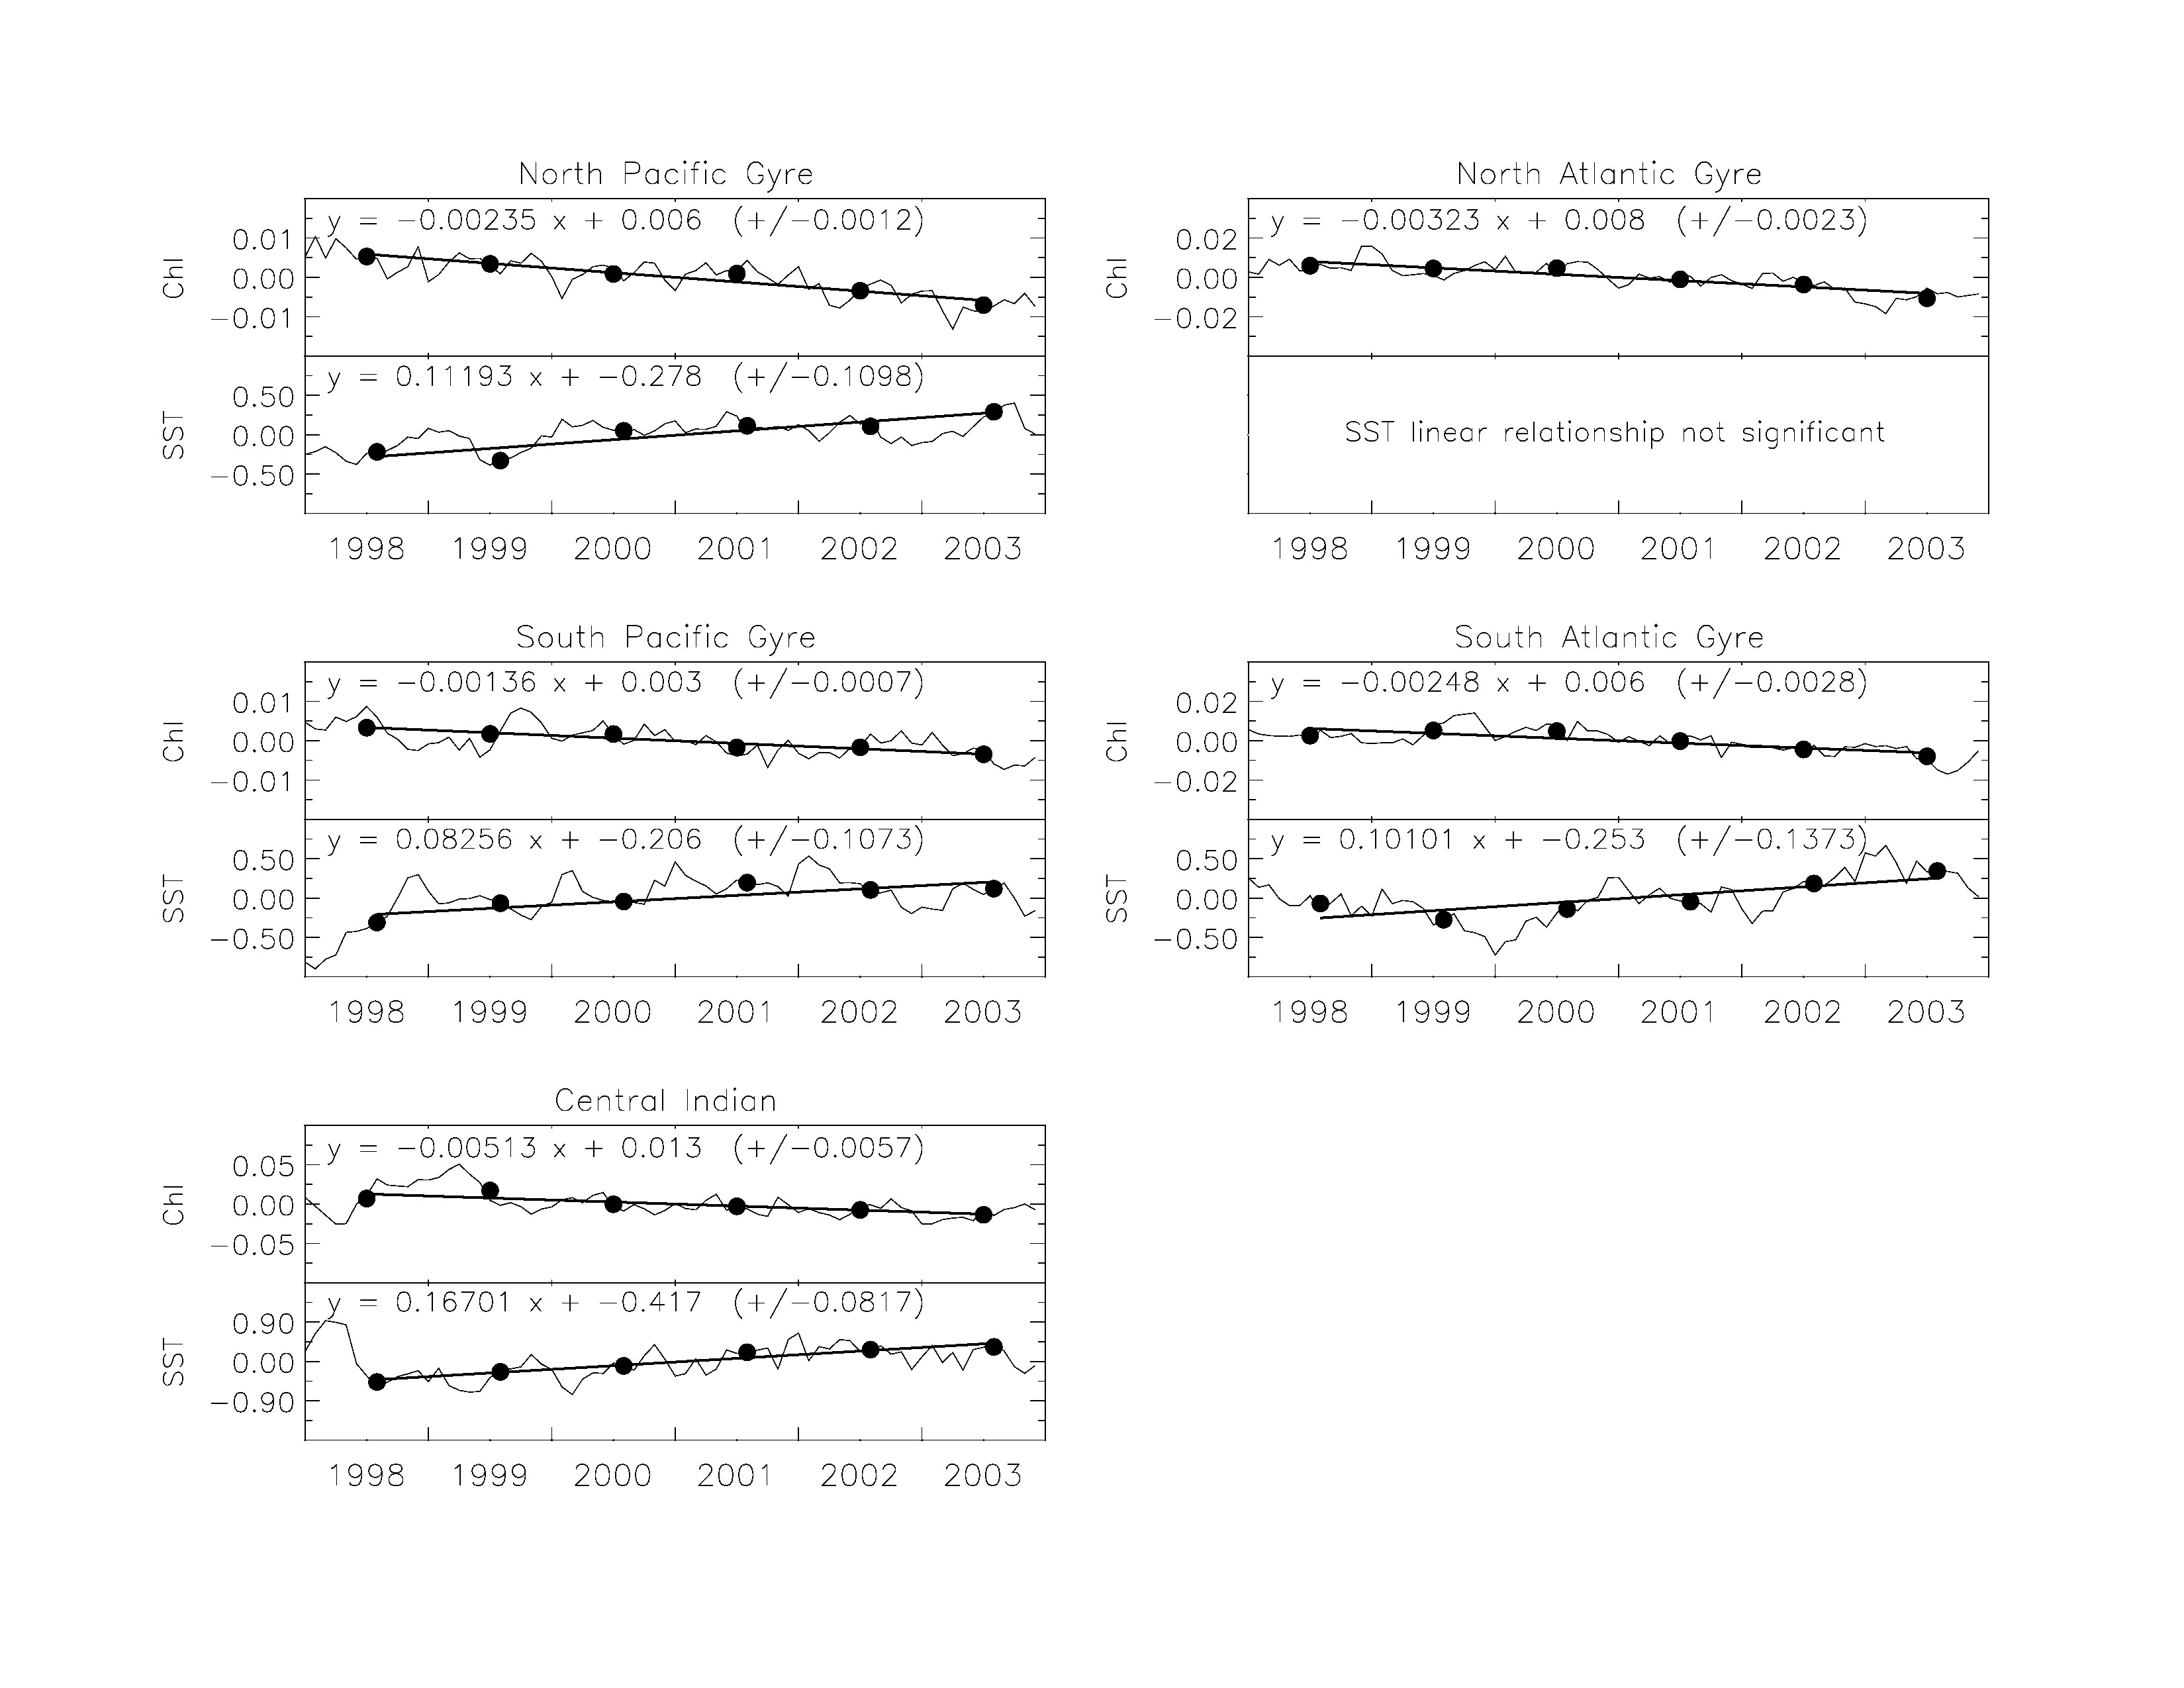
Trends in Chlorophyll Concentrations and Sea Surface Temperatures
Declines in phytoplankton amounts in five mid-ocean gyres or “ocean deserts” were observed over the six-year study period, including
the North and South Atlantic, and North and South Pacific oceans, and a possible new region of low phytoplankton abundance in the North Central
Indian ocean. At the same time, for all but the North Atlantic gyre, sea surface temperatures (SSTs) increased in at least one season. Credit: NASA
(Gregg et al.)
High-Resolution Image
|


