|
 Centers for Disease
Control and Prevention
Division of Cancer
Prevention and Control
4770 Buford Hwy, NE
MS K-64
Atlanta, GA 30341-3717
Call: 1 (800) CDC-INFO
TTY: 1 (888) 232-6348
FAX: (770) 488-4760
E-mail: cdcinfo@cdc.gov
Submit a Question Online
|
|
|
|
National Aggregate
On this page
Tables and graphs report on cancer screening services provided through the program in a recent 5-year
period. The data represent clinical services funded directly through the NBCCEDP as reported in the April 2008
submission of the NBCCEDP Minimum Data Elements (MDE).
National aggregate data are typically used to report results from the
program and as a standard to compare results of grantee programs. Comparing data across grantee programs
is not advised due to extensive variation across programs.
For information on interpreting the data, refer to Screening Program Data.
For information on the program, refer to About the Program.
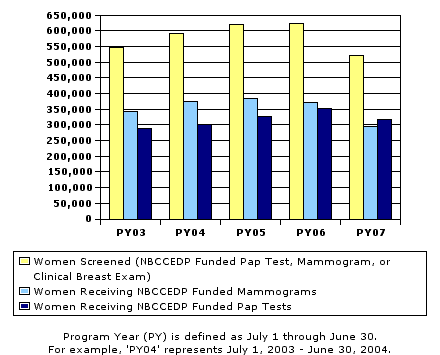
Screening Totals by Year
Program Overview
Women Served through the NBCCEDP
Five-Year Summary, 7/2002 to 6/2007
National Aggregate |
| Women served* |
1,879,496 |
| Women screened** |
1,824,338 |
| Women receiving mammography |
1,146,391 |
| Women receiving Pap tests |
1,118,235 |
Each category reports counts of unduplicated women receiving services within the 5-year period. Women may be counted in more than one category.
* Women served includes women receiving any NBCCEDP-funded screen or diagnostic procedure.
** Women screened includes women receiving any NBCCEDP-funded screen (mammography, clinical breast exam, or Pap test).
Data Source: April 2008 submission of NBCCEDP Minimum Data Elements (MDE)
|
Cervical Cancer Screening
Distribution by Race/Ethnicity
Five-Year Summary, 7/2002 to 6/2007
National Aggregate
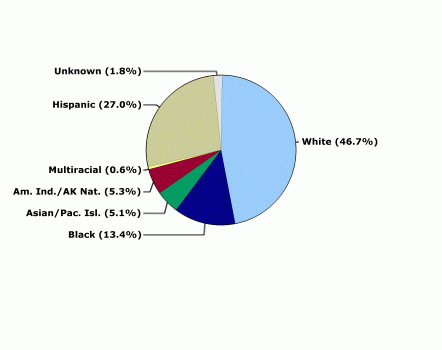
Women receiving an NBCCEDP-funded Pap test = 1,118,235
|
Distribution by Age
Five-Year Summary, 7/2002 to 6/2007
National Aggregate
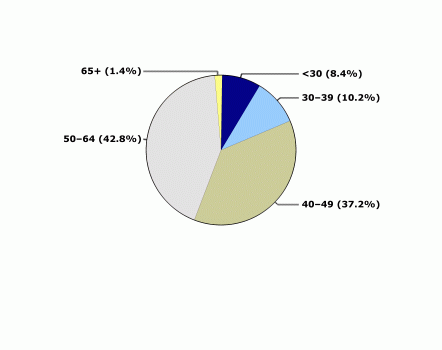
Women receiving an NBCCEDP-funded Pap test = 1,118,235
|
|
See text description of these graphs.
|
Cervical Cancer Screening Results and Outcomes
Five-Year Summary, 7/2002 to 6/2007
National Aggregate |
| Pap tests provided |
1,641,972 |
| Pap tests with abnormal results* |
45,746 |
| Percentage of Pap tests with abnormal results |
2.8 |
| Age-adjusted percentage** |
2.4 |
| Cervical cancers or cancer precursor lesions detected*** |
25,152 |
| CIN-1 or LSIL |
13,756 |
| CIN-2 or worse**** |
11,396 |
| Rate of CIN-2 or worse detected per 1,000 Pap tests**** |
6.9 |
| Age-adjusted rate per 1,000 Pap tests** |
5.7 |
* Abnormals include Pap test results of: low-grade squamous intraepithelial lesion (LSIL), high-grade squamous intraepithelial lesion (HSIL), atypical squamous cells of undetermined significance – cannot exclude HSIL (ASC-H), atypical glandular cells (AGC), and squamous cell cancer.
** Adjusted to the age distribution of NBCCEDP participants having Pap tests performed in calendar year 2000.
*** Includes LSIL, HSIL, cervical intraepithelial neoplasia (CIN)-1, CIN-2, CIN-3, carcinoma in situ (CIS), and invasive cervical cancer.
**** Includes HSIL, CIN-2, CIN-3, CIS, and invasive cervical cancer.
Table includes only NBCCEDP-funded Pap tests. An additional 28,745 women, not included above, were diagnosed with LSIL, HSIL, CIN-1, CIN-2, CIN-3, CIS, or invasive cervical cancer through the NBCCEDP following a Pap test funded through another source.
|
Breast Cancer Screening
Distribution by Race/Ethnicity
Five-Year Summary, 7/2002 to 6/2007
National Aggregate
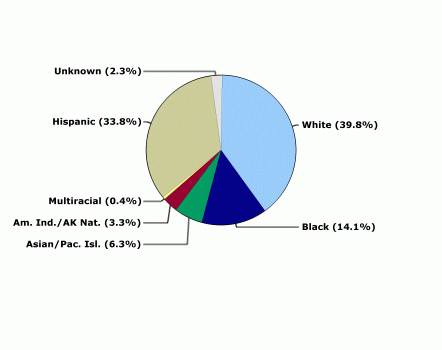
Women receiving an NBCCEDP-funded mammogram = 1,146,391
|
Distribution by Age
Five-Year Summary, 7/2002 to 6/2007
National Aggregate
Women receiving an NBCCEDP-funded mammogram = 1,146,391
|
|
See text description of these graphs.
|
Breast Cancer Screening Results and Outcomes
Five-Year Summary, 7/2002 to 6/2007
National Aggregate |
| Mammograms provided |
1,785,597 |
| Abnormal mammograms* |
217,887 |
| Percentage of abnormal mammograms |
12.2 |
| Age-adjusted percentage** |
12.0 |
| Breast cancers detected*** |
14,682 |
| Rate of breast cancers detected per 1,000 mammograms |
8.2 |
| Age-adjusted rate per 1,000 mammograms** |
8.2 |
* Abnormals include mammogram results of: suspicious abnormality, highly suggestive of malignancy, and assessment incomplete.
** Adjusted to the age distribution of NBCCEDP participants 40 years of age and older having mammograms performed in calendar year 2000.
*** Breast cancers include invasive breast cancer, ductal carcinoma in situ (DCIS), and other in situ excluding lobular carcinoma in situ (LCIS).
Table includes only NBCCEDP-funded mammograms provided to women age 40 and older. An additional 4,500 women, not included above, were diagnosed with CIS (other), DCIS, or invasive breast cancer through the NBCCEDP following a mammogram funded through another source.
|
Text Description of Screening Totals by Year Graph
Women Screened through the NBCCEDP, by Year
7/2002 to 6/2007
National Aggregate |
| Year |
Women Screened |
Women Receiving
NBCCEDP-Funded Mammograms |
Women Receiving
NBCCEDP-Funded Pap Tests |
| PY2003 |
548,768 |
343,187 |
291,317 |
| PY2004 |
592,187 |
376,008 |
304,660 |
| PY2005 |
621,204 |
387,051 |
328,261 |
| PY2006 |
626,210 |
374,205 |
353,279 |
| PY2007 |
524,256 |
295,338 |
318,220 |
| Return to the Screening Totals by Year section |
Text Description of Cervical Cancer Screening Graphs
Distribution by Race/Ethnicity
Five-Year Summary, 7/2002 to 6/2007
National Aggregate
|
| Race |
Percentage |
| White |
46.7 |
| Black |
13.4 |
| Asian/Pacific Islander |
5.1 |
| American Indian/Alaska Native |
5.3 |
| Multiracial |
0.6 |
| Hispanic |
27.0 |
| Unknown |
1.8 |
|
Women receiving an NBCCEDP-funded Pap test = 1,118,235 |
Distribution by Age
Five-Year Summary, 7/2002 to 6/2007
National Aggregate
|
| Age |
Percentage |
| <30 |
8.4 |
| 30–39 |
10.2 |
| 40–49 |
37.2 |
| 50–64 |
42.8 |
| 65+ |
1.4 |
| Unknown |
< 0.1 |
|
Women receiving an NBCCEDP-funded Pap test = 1,118,235 |
Return to the Cervical Cancer Screening section
Text Description of Breast Cancer Screening Graphs
Distribution by Race/Ethnicity
Five-Year Summary, 7/2002 to 6/2007
National Aggregate
|
| Race |
Percentage |
| White |
39.8 |
| Black |
14.1 |
| Asian/Pacific Islander |
6.3 |
| American Indian/Alaska Native |
3.3 |
| Multiracial |
0.4 |
| Hispanic |
33.8 |
| Unknown |
2.3 |
|
Women receiving an NBCCEDP-funded mammogram = 1,146,391 |
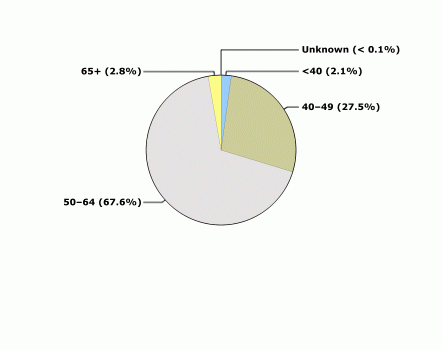
Distribution by Age
Five-Year Summary, 7/2002 to 6/2007
National Aggregate
|
| Age |
Percentage |
| <40 |
2.1 |
| 40–49 |
27.5 |
| 50–64 |
67.6 |
| 65+ |
2.8 |
| Unknown |
< 0.1 |
|
Women receiving an NBCCEDP-funded mammogram = 1,146,391 |
Return to the Breast Cancer Screening section
|
|