Beatriz was a typical eastern north Pacific hurricane that was of concern
only to ships at sea.
a. Synoptic History
On 26 June, a tropical wave emerged from Africa, accompanied by disorganized
deep convection. This system moved fairly rapidly, at 20 knots or more,
across the tropical Atlantic. The northern portion of the wave triggered
extensive cloudiness and showers over the Bahamas and the waters around
southern Florida on the 2nd and 3rd of July. The system moved over Central
America and extreme eastern Mexico on the 4th and 5th. By 6 July,
cloudiness and deep convection were becoming more consolidated in the
vicinity of the Gulf of Tehuantepec. A center of cloud rotation was noted a
couple hundred n mi south-southwest of the Gulf of Tehuantepec around 0600
UTC 7 July, but there was insufficient deep convection and curvature for a
Dvorak classification at that time. The system remained very disorganized
over the following 24 hours or so.
The initial classification, a T1.0 on the Dvorak scale, was done by the
Tropical Prediction Center at 1145 UTC 8 July. A gradual increase in
organization was noted from visual satellite imagery on the 8th, with
increasing curvature in bands of convective clouds surrounding the center of
the system. Late on the 8th and early on the 9th, a more rapid increase in
organization occurred, and it is estimated that the second tropical
depression of the season formed just over 300 n mi south of Lazaro Cardenas,
Mexico at about 0600 UTC 9 July (Table 1).
Upper-tropospheric outflow
appeared to be strong over the area, and steady intensification occurred for
about 18 hours after genesis. The cyclone strengthened into Tropical Storm
Beatriz by 1200 UTC on the 9th. Maximum winds increased to near 45 knots by
0000 UTC 10 July, however, for unknown reasons, the intensification ceased
for the next 12 to 18 hours. Then, Beatriz started to strengthen again, and
it is estimated that it became a hurricane around 1200 UTC 11 July, while
centered about 560 n mi south-southwest of Cabo San Lucas.
With a mid-tropospheric ridge in place to the north, Beatriz moved westward
or just slightly north of westward, i.e., on about the climatological
heading, during its strengthening from depression to hurricane. Beatriz
continued to strengthen, as a well-defined eye appeared in satellite imagery
around 0000 UTC 12 July. Early on the 12th, microwave imagery data showed
evidence that Beatriz had concentric eyewalls, and the hurricane was
probably undergoing an eyewall replacement. By 1700 UTC, the microwave data
suggested a single, 20-25 n mi thick, closed eyewall. It is estimated that
the hurricane reached its peak intensity, 105 knots, around 0600 UTC 13
July, with a clear-cut 20 n mi diameter eye centered about 800 n mi
southwest of Cabo San Lucas. In response to a slight weakness in the
subtropical ridge, Beatriz turned to a west-northwestward direction and
began a gradual weakening trend after 1200 UTC on the 13th. With the
hurricane passing over only slightly cooler waters, the weakening was quite
slow for 48 hours; maximum winds were down to about 80 knots by 1200 UTC 15
July. Thereafter, the decline was more rapid, with Beatriz weakening to a
tropical storm by 0000 UTC on the 16th, and to a depression by 1800 UTC that
same day. After being reduced to a swirl of mostly low clouds, the cyclone
turned to a more westward heading, and dissipated by 0600 17 July in the
general vicinity of 20N 135W.
b. Meteorological Statistics
Figure 1 is a plot of the "best track" positions for
Beatriz. Figure 2 and Figure 3
are curves of the best track maximum sustained (1 min average) surface
(elevation of 10 m) wind speed and minimum central pressure, respectively,
as well as the observations on which these curves are based. Satellite
imagery was used to locate the center of Beatriz throughout its existence,
and the best track winds and pressures were based on Dvorak-technique
estimates provided by the Tropical Analysis and Forecast Branch (TAFB), the
NOAA/NESDIS Satellite Analysis Branch (SAB), and the Air Force Weather
Agency (AFGWC in the figures).
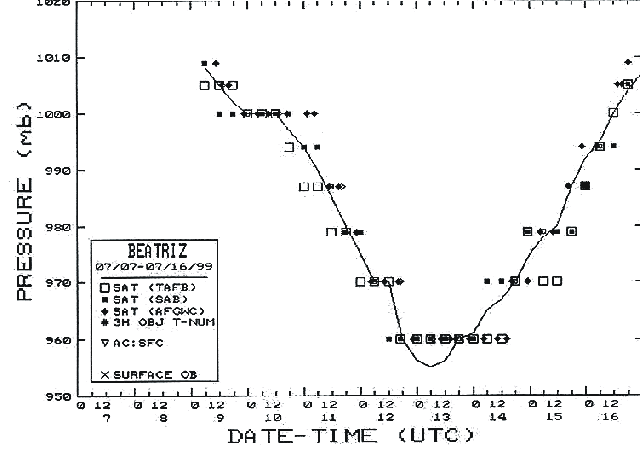
Although the maximum winds of the hurricane were estimated to be close to
105 knots from 0000 UTC to 1200 UTC 13 July, 3-hourly averaged objective
Dvorak T-numbers suggest that the minimum central pressure of Beatriz
occurred closest to 0600 UTC 13 July.
A ship with call sign VRUM4 reported tropical storm force winds
(030/35 knots) about 190 n mi north-northeast of the center of Hurricane
Beatriz at 1200 UTC 13 July.
c. Casualty and Damage Statistics
Not surprisingly, since Beatriz remained at sea, there were no reports of
casualties or damage.
d. Forecast and Warning Critique
Table 2 summarizes the track forecast errors for
Beatriz. It can be seen that the mean official track forecast errors were
substantially lower than the long-term averages. Among the various track
prediction models, only the UKMI had a lower average error than the official
forecast.
There were some large intensity under-predictions, around 35 knots in the
48- and 72-hour official forecasts, on 10 and 11 July. Otherwise, the
official intensity forecast errors were 10 to 15 knots or less. The GFDL
model did a particularly poor job in the 48- to 72-hour intensity forecasts
from 10-11 July, with the model showing Beatriz to be practically dissipated
at about the time of its (actual) maximum strength.
No watches or warnings were issued for Beatriz.
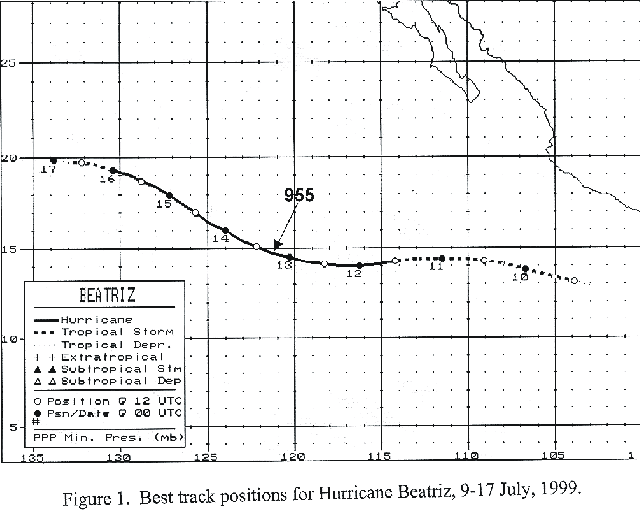
Figure 1.
Best track positions for Hurricane Beatriz, 9-17 July 1999.

Figure 2.
Best track one-minute surface wind speed curve for Hurricane Beatriz, 9-17
July 1999.

Figure 3.
Best track minimum central pressure curve for Hurricane Beatriz, 9-17 July
1999.
Table 1.
Best track, Hurricane Beatriz, 9-17 July, 1999
Date/Time
(UTC) |
Position |
Pressure
(mb) |
Wind Speed
(kt) |
Stage |
| Lat. (°N) |
Lon. (°W) |
| 9/0600 | 12.9 | 103.0 | 1008 | 30 | tropical depression |
| 1200 | 13.1 | 103.9 | 1005 | 35 | tropical storm |
| 1800 | 13.4 | 105.2 | 1002 | 40 | " |
| 10/0000 | 13.8 | 106.7 | 1000 | 45 | " |
| 0600 | 14.1 | 108.0 | 1000 | 45 | " |
| 1200 | 14.3 | 109.1 | 1000 | 45 | " |
| 1800 | 14.4 | 110.2 | 997 | 50 | " |
| 11/0000 | 14.4 | 111.5 | 994 | 55 | " |
| 0600 | 14.4 | 112.9 | 990 | 60 | " |
| 1200 | 14.3 | 114.2 | 985 | 65 | hurricane |
| 1800 | 14.1 | 115.2 | 980 | 75 | " |
| 12/0000 | 14.0 | 116.3 | 975 | 85 | " |
| 0600 | 14.0 | 117.4 | 970 | 90 | " |
| 1200 | 14.1 | 118.3 | 970 | 90 | " |
| 1800 | 14.2 | 119.3 | 960 | 100 | " |
| 13/0000 | 14.5 | 120.3 | 956 | 105 | " |
| 0600 | 14.7 | 121.3 | 955 | 105 | " |
| 1200 | 15.1 | 122.2 | 956 | 105 | " |
| 1800 | 15.4 | 123.0 | 960 | 100 | " |
| 14/0000 | 16.0 | 124.0 | 961 | 100 | " |
| 0600 | 16.4 | 124.9 | 965 | 95 | " |
| 1200 | 17.0 | 125.7 | 967 | 95 | " |
| 1800 | 17.5 | 126.5 | 970 | 90 | " |
| 15/0000 | 17.9 | 127.2 | 975 | 85 | " |
| 0600 | 18.4 | 128.0 | 978 | 80 | " |
| 1200 | 18.7 | 128.8 | 980 | 75 | " |
| 1800 | 19.0 | 129.4 | 987 | 65 | " |
| 16/0000 | 19.3 | 130.4 | 992 | 60 | tropical storm |
| 0600 | 19.6 | 131.5 | 995 | 55 | " |
| 1200 | 19.7 | 132.2 | 1000 | 45 | " |
| 1800 | 19.7 | 132.7 | 1004 | 30 | tropical depression |
| 17/0000 | 19.8 | 133.8 | 1007 | 25 | " |
| 0600 | | dissipated |
| |
| 13/0600 | 14.7 | 121.3 | 955 | 105 | minimum pressure |
Table 2.
Preliminary track forecast evaluation of Hurricane Beatriz - heterogeneous
sample. Errors in nautical miles for tropical storm and hurricane stages
with number of forecasts in parenthesis.
| Forecast Technique |
Period (hours) |
| 12 | 24 | 36 | 48 | 72 |
| CLIP | 27 (27) | 51 (25) | 80 (23) | 113 (21) | 165 (17) |
| GFDI | 39 (27) | 77 (25) | 113 (23) | 123 (20) | 134 (16) |
| GFDL* | 27 (26) | 65 (24) | 103 (22) | 127 (20) | 138 (16) |
| LBAR | 27 (27) | 67 (25) | 118 (23) | 177 (21) | 299 (17) |
| AVNI | 37 (24) | 90 (24) | 173 (19) | 275 (10) | 427 (5) |
| BAMD | 26 (27) | 51 (25) | 85 (23) | 129 (21) | 209 (17) |
| BAMM | 33 (27) | 71 (25) | 128 (23) | 200 (21) | 338 (17) |
| BAMS | 34 (27) | 70 (25) | 127 (23) | 203 (21) | 335 (17) |
| P91E | 27 (27) | 50 (25) | 75 (23) | 106 (21) | 170 (17) |
| NGPI | 41 (22) | 78 (21) | 96 (19) | 113 (18) | 170 (15) |
| UKMI | 19 (25) | 33 (23) | 49 (21) | 68 (19) | 102 (15) |
| |
| NHC OFFICIAL | 26 (27) | 50 (25) | 72 (23) | 99 (21) | 111 (17) |
| NHC OFFICIAL 1988-1997 10-year average | 39 (2527) | 71 (2266) | 105 (1998) | 137 (1755) | 195 (1337) |
*GFDL output not available until after forecast issued.
![[NCEP Logo]](graphics/ncep.gif)