Slide 1
MAE Center research Success with DOTs
Past and Future
Neil M. Hawkins - Professor Emeritus
University of Illinois
MAE Center Annual Meeting - 2002
PowerPoint Version (5 mb)
PowerPoint files can be viewed with the PowerPoint Viewer
With sincere appreciation of the contributions of Professors DeRoches and French (Georgia Tech), Aschheim, LaFave and Long (Illinois), Hwang (Memphis), and personnel from GaDOT, IDOT and TDOT and Caltrans
Slide 2
ORGANIZATION OF PRESENTATION
- BACKGROUND - Lifeline Considerations for Transportation Systems
- BACKGROUND - The Highway System Lifeline
- OVERVIEW OF MAE TRANSPORTATION RESEARCH ACTIVITIES AND SUCCESSES
- VISION FOR FUTURE
Slide 3
THE TRANSPORTATION SYSTEM AS A LIFELINE
- DESIGN REQUIRES CONSIDERATION OF FACTORS DIFFERING FROM THOSE FOR BUILDINGS
- ACCEPTABLE PERFORMANCE DEPENDS ON:
- Functionality of System after Event and Not Life Safety During Event
- Financial Impact of Event
Slide 4
FINANCIAL IMPACTS
- REVENUE LOSSES
- FACILITY REPAIR COSTS*
- LIABILITY EXPOSURE
- RESPONSIBILITY TO SOCIETY*
Slide 5
THE HIGHWAY SYSTEM LIFELINE
- SPACIALLY DISTRIBUTED COMPONENTS INTERCONNECTED OPERATIONALY AND PHYSICALLY
- REDUNDANCY ALLOWS SOME LEVEL OF LOCAL DAMAGE
- AGENCY'S JURISDICTION DETERMINES ITS RESPONSIBILITIES
- SEISMIC HAZARD DEFINED BETTER BY SCENARIO EVENT THAN PROBABILISTIC GROUND MOTION
Slide 6
HIGHWAY LIFELINE SYSTEM DESIGN
- PERFORMANCE GOALS FOR SCENARIO EARTHQUAKE - 2 Rather than 1.5 on Estimated Ground Motions?
- IDENTIFICATION AND QUANTIFICATION OF HAZARD - Soil Liquefaction, Permanent Ground Deformations, Structural Movements and Failures, and Importance of EQ Event Relative to Other Hazards.
- ASSESS DAMAGE STATE FOR SCENARIO EVENT - Functionality of Components, Time and Cost to Repair.
- EVALUATE SYSTEM FUNCTIONALITY- IDENTIFY RISK REDUCTION OPTIONS (CBE)
Slide 7
 Figure 2-4: Integration of Transportation Officials Stakeholder Thrust Area Research with Core Research
Slide 8
HIGHWAY INVENTORY
NEW MADRID SEISMIC ZONE
- CHARACTERISTICS OF SYSTEM WITHIN AREA WITH 0.1g ACCELERATION FOR 500 YEAR RETURN PERIOD
- Age for 90% of Bridges
- Interstate 1966 + - 8 years
- Overpass 1963 + - 8years
- Type of Bridge
- 2/3rds Continuous
- Steel : Concrete
- 4:1 Overpasses
- 1:1 Interstate
- NBI Lacks Information on Bearing, Bent, Foundation, and Soil Characteristics
- Interstate Bridge Characteristics Different to Secondary Road
Slide 9
HIGHWAY INVENTORY
ILLINOIS SOUTH OF I-70
 Elevation of Typical Bridge
- BRIDGE CHARACTERISTICS VERY DIFFERENT TO CALIFORNIA BRIDGES. PIERS NOT INTEGRAL WITH BEAMS OR DECK.
- 533 Bridges on Primary Emergency Routes (Interstates)
- For 10% Sample:
- 2/3rds Steel Continuous
- Support Type:
- 50% Multi-Col. Pier
- 40% Wall-Pier
- 90% of Foundations Pile Supported
- 30% on Soil Likely to Liquefy
Slide 10
VULNERABILITY-FUNCTIONALITY RELATIONSHIPS
- EXPERT OPINION -"EMPIRICAL" RELATIONSHIPS - HAZUS
- ANALYTICAL RELATIONSHIPS
- Approach Slabs
- Major River Crossing
- Pavement
- "Standard" Bridge
- EQ with 10% probability in 50 years causes little structural damage to as-built interstate bridges.
- EQ with 2% probability in 50 years causes wide damage to steel bearings, columns and foundations
Slide 11
DAMAGE TYPES
 Lateral Load Performance
(Brittle Deficiencies)BRITTLE
- Bearing or Pedestal Failure
- Beam or Column Shear Failure
- Column Lap Splice
- Pile Shear or Pullout
 Lateral Load Performance
(Ductile Deficiencies & Displacement)DUCTILE
- Bearing Overturning
- Excessive Pier Drift
- Excessive Ground Displ.
- Pile Flexure
Slide 12
RETROFIT STRATEGIES
Methodology- Flow Diagram for Retrofitted Piers
- Restrainer Cables
- Elastomeric Bearings
- Column and Cap Beam Wrapping
- Micropile Additions
Slide 13
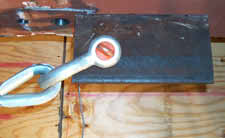
RESTRAINER CABLES
Restrainer Cables are used to ensure that bridge beams movements relative to the bearings are restricted and beams cannot displace off bearings longitudinally or transversally.
Slide 14
RESTRAINER CABLES
FXB: Fixed Steel Bearing. EXB: Expansion Steel Bearing
Slide 15
RESTRAINER CABLES - TEST RESULTS
Cable Restrainer Load - Displacement

Over 100 Restrainer Retrofits Modified by TN DOT
Slide 16
ELASTOMERIC BEARINGS
- Allows for Temperature Effects. While Bearings Compress Little They Deform Easily in Shear.
- Hysteresis Small W/o Slip at Interface and Large with Slip.
- Are Hysteresis Characteristics Advantageous for EQ Effects?
- Does Stiffening of Elastomer with Decreasing Temperature Obviate Beneficial Effects for EQ?
Slide 17
ELASTOMERIC BEARINGS
- Tests Conducted on New and Used Bearings to Find Changes in Slip, Stiffness and Hysteretic Characteristics with Decreasing Temperature and Increasing Cyclic Deformations.
- Dynamic Analyses Made For Typical 4 Span Bridge with Fixed Bearing at Central Pier and Elastomeric Type II Bearings at Side Piers and Type I at Abutments.
 Bridge Elevation
Slide 18
ELASTOMERIC BEARINGS
- Temperature Effect Unpredictable. Vary Widely with Materials Used by Manufacturer
- Elastomeric Bearing Use Can Reduce or Increase Pier Forces. Type and Location Must Be Properly Selected.
Slide 19
COLUMN AND BEAM WRAPPING
- Prevents Shear and Lap Splice Failures and Increases Flexural Ductility Capacity.
- Steel or Composite Placed as Bands or as Encasement. Effectiveness Varies with Form and Quality Control.
- Encasement More Aesthetically Pleasing But Results in Accelerated Deterioration if Located Below Deck Joint.
- Effective on Deteriorated Members if Member Properly Repaired First.
Slide 20
COLUMN CAPACITY DESIGN RETROFIT

As-built |
Retrofitted |
Base shear capacity in terms of pier elements
Slide 21
COLUMN AND BEAM WRAPPING
Effect of As-Built versus Retrofit
Slide 22
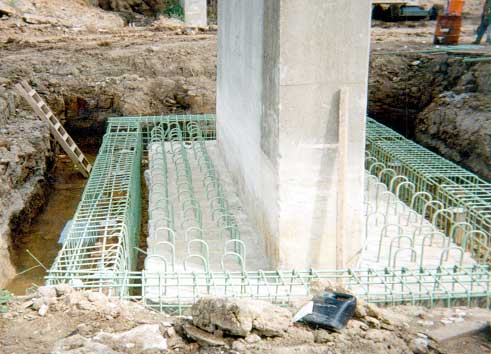
FOUNDATION IMPROVEMENT WITH MICROPILES
- To Increase Foundation Capacity or Stiffness
- To Resist Overturning Where Existing Cap to Pile Connections Are Inadequate
- To Extend Piles Below Liquefiable Layer While Maintaining Vertical Load Capacity During EQ.
Slide 23
FOUNDATION IMPROVEMENT USING MICROPILES
Case Study Foundations

3x3 Retrofitted
Pile Group

3x10 Retrofitted
Pile Group
Slide 24
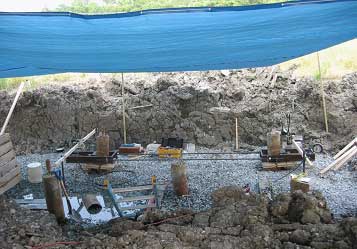
FOUNDATION IMPROVEMENT USING MICROPLIES
- Stiffness Increased 50% with 3x3 Pile Addition.
- Even With Retrofit Liquefaction Near Surface Substantially Reduced Pier Lateral Stiffness.
- Dynamic Rotational Stiffness Increased Regardless of Which Soil Layer Liquefied.
- Stiffness in Field Tests Less Than Predicted
Slide 25
VULNERABILITY- FUNCTIONALITY FOR MID-AMERICA BRIDGES
- Methodology to Derive Relationships, Repair Costs and Recovery Time Developed By Hwang (Memphis).
- Response of Typical Multi-Span Bridge Controlled by Response of Central Pier.
- Vulnerability Functions Derived for "Standard" Bridge for Longitudinal (GaTech) and Transverse Directions (UIUC)
Slide 26
VISION FOR FUTURE
- Consensus Criteria Developed for CBE and Performance Based Design of EQ Emergency Routes in NMSZ Using FHWA Pooled Funds.
- Design All New, and Systematically Upgrade All Existing, Major River Crossings and Their Approaches to AASHTO-LRFD Seismic Criteria.
- Identify Life Safety Needs of Communities and Design and Upgrade Routes Consistent with Those Needs.
- Design Other New Structures, and Upgrade Other Existing Structures, to EQ with 10 % PE in 50 years.
- MAEC Has Developed The Tools and Skilled Personnel to Successfully Complete That Task.