skip to content
Seal of U.S. Department of Labor
U.S. Department of Labor
Employment & Training Administration

Photos representing the workforce - Digital Imagery© copyright 2001 PhotoDisc, Inc.

www.doleta.gov
Advanced Search
About Us Find Job & Career Information Business and Industry Workforce Professionals Grants and Contracts ETA Library Foreign Labor Certification Performance and Results Regions and States
ETA Home  >  Performance and Administration > 
Sitemap   Printer Friendly Version

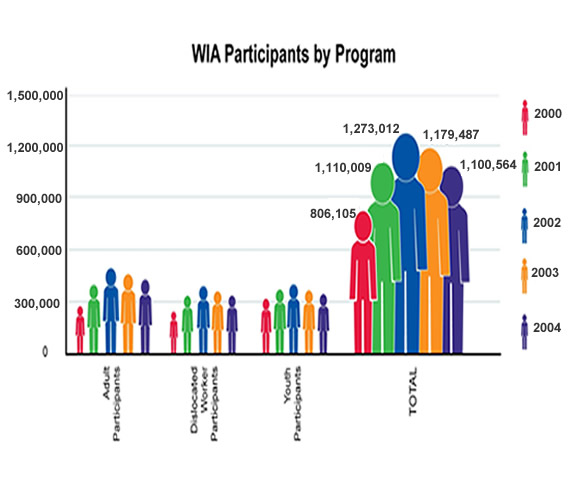
WIA Participants by Program for PY 2000-2001-2002-2003-2004

A chart showing the number of participants served by the WIA Adult, Dislocated Worker, and Youth programs from PY 2000 through PY 2004

The number of individuals served by each of the WIA programs (Adults, Dislocated Workers, and Youth) increased from PY 2000 to PY 2002. In PY 2000, the WIA programs served 806,105 people. This figure increased to 1,273,012 in PY 2002, but declined to 1,179,487 in PY 2003, and has declined to 1,100,564 in PY 2004. (see Table 1 below).

Table 1


 2000
 2001
 2002
 2003
 2004
 Adult
 268,670
 399,014
 467,255
 444,684
 432,194
 Dislocated Worker
 230,403
 335,060
 397,564
 365,199
 327,640
 Youth
 307,032
 375,935
 408,193
 369,604
 340,730


 TOTAL
 806,105
 1,110,009
 1,273,012
 1,179,487
 1,100,564


Created: November 07, 2005