
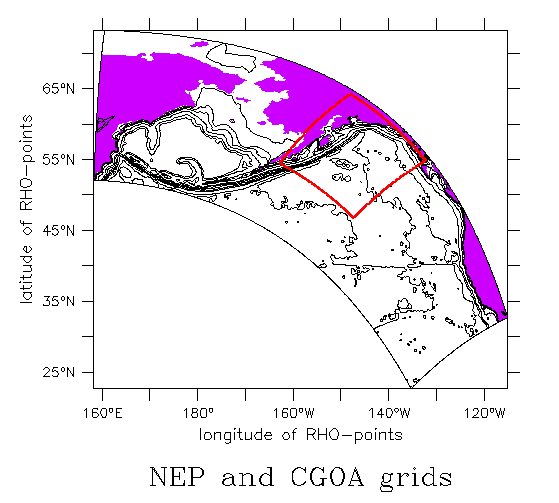
Northeast Pacific Grid
Characteristics
|
The model was initialized with results from the NPac model,
and run for 1996 through 2002 with NCEP forcing. The resulting
sea surface height anomaly are shown below (left) compared to
TOPEX (right). Click image for animation. Eddies of realistic size
and seasonality are produced, as are El Nino related interannual variations.

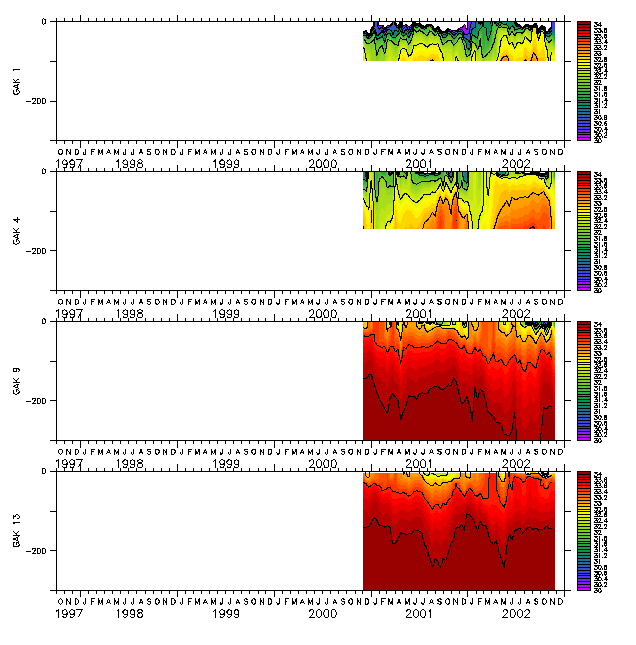
Run with NCEP forcing:
| Temperature | Salinity |
|---|---|

Temperature (Celcius) sampled at 4 model locations approximating stations 1, 4, 9, and 13 along the Seward line. |

Salinity (ppt) sampled at 4 model locations approximating stations 1, 4, 9, and 13 along the Seward line. |
The run with MM5 forcing:
| Temperature | Salinity |
|---|---|

Temperature (Celcius) sampled at 4 model locations approximating stations 1, 4, 9, and 13 along the Seward line. |
Salinity (ppt) sampled at 4 model locations approximating stations 1, 4, 9, and 13 along the Seward line. |

Contents last updated
by
Elizabeth.Dobbins@noaa.gov
US Department of Commerce |
NOAA |
OAR |
PMEL
 http://www.pmel.noaa.gov/~dobbins/nep3/index.html
Links do not imply government endorsement of linkee.