Publications and Information Products

March 2008
The Three Leading Causes of Injury Mortality in the United States, 1999-2005
by Lois A. Fingerhut, M.A., Office of Analysis and Epidemiology, and Robert N. Anderson, Ph.D., Division of Vital Statistics
PDF version 100 KB
Page Content
Other ages Conclusion Data source References Related Report Figures
Leading causes of injury deaths-overall trends
In 2005, poisoning continued to be the second leading cause of injury death in the United States, having surpassed firearms for the first time in 2004. In 2004, poisoning deaths exceeded those related to firearms by 2%; however, the difference increased to 7% in 2005, with 32,691 poisoning deaths compared with 30,694 firearm deaths. Motor vehicle traffic (MVT) deaths were the leading cause of injury death from 1999-2005, accounting for 43,667 deaths in 2005. From 2004 to 2005, MVT deaths increased 1%, firearm deaths, 4% and poisoning deaths, 8%. (1,2)
The age distribution of poisoning deaths differs from that for MVT and firearm deaths. The 2005 poisoning death rate peaked at ages 45-54 years, whereas the MVT and firearm death rates peaked at ages 20-24 years, with a secondary peak for MVT deaths at 85 years and over, see Figure 1. Before 2005, the highest poisoning death rate had been at ages 35-44 years, but it has shifted to ages 45-54 years.
Poisoning deaths at each age group were more likely to be classified as unintentional rather than as suicides or homicides; for all ages, 72% of poisoning deaths were classified as unintentional in 2005. Firearm deaths were more apt to be homicides at younger ages and suicides at older ages. MVT deaths, by definition, are all classified as unintentional.
Poisoning deaths are also classified by whether they were drug related or due to other substances. In 2005, 91% of all poisoning deaths were classified as drug related, and 95% of all unintentional poisoning deaths were drug related.
Four out of five poisoning deaths occur between ages 20 and 54 years, and because poisoning continues to be the second leading cause of injury death, the remaining sections of this report look at the subgroups of this age group for the three leading causes of injury death in more detail.
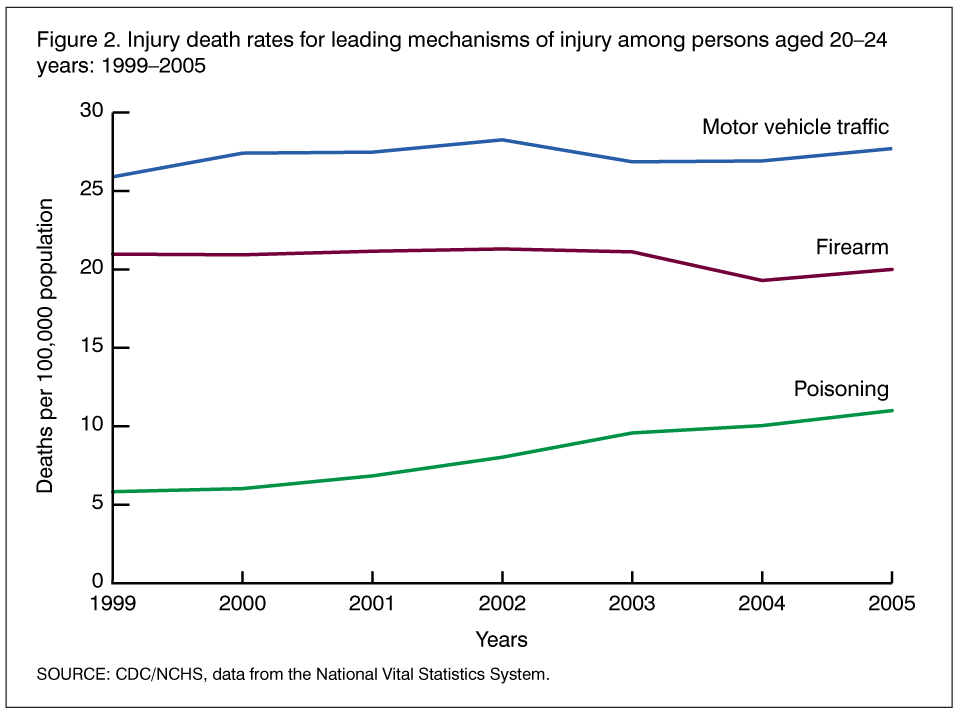
Ages 20-24-Throughout the period 1999-2005, injuries accounted for three-fourths of all deaths among young people 20-24 years of age. In 2005, MVT, the leading cause of injury deaths in this age group, accounted for 38% of all injury deaths; and firearms, the second leading cause of injury death, accounted for 27% of all injury deaths (down from 31% in 1999). Poisoning death, while continuing to be the third leading cause of injury death, increased from 9% to 15% of all injury deaths from 1999-2005. During this period, unintentional drug-related poisoning increased from 59% to 76% of all poisoning deaths.
From 1999-2005, MVT and firearm death rates did not change significantly, whereas the poisoning death rate increased at an average annual rate of 12.2%, see Figure 2. The unintentional drug poisoning death rate increased at an annual rate of 16.7% per year (average annual percentage change calculated using Joinpoint software developed by the National Cancer Institute), see Figure 6.
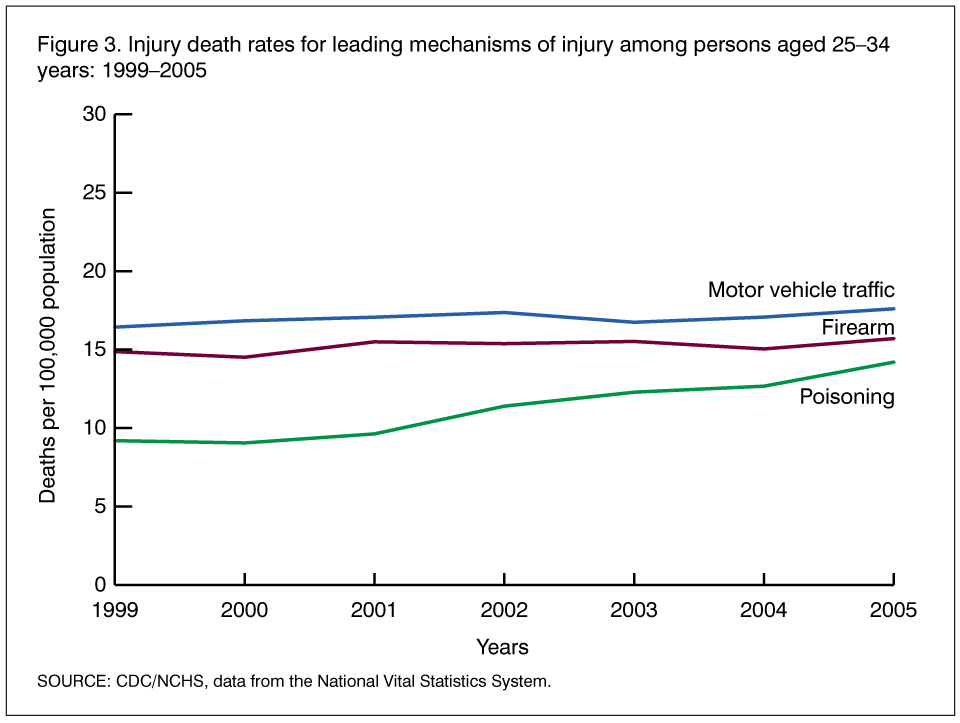
Ages 25-34-Injuries increased from 54% to 59% of all deaths in this age group from 1999-2005. MVT deaths continue to be the leading cause of injury death followed by deaths from firearms, accounting for 29% and 26%, respectively, of all injury deaths in 2005. Poisoning deaths accounted for 17% of injury deaths in 1999, increasing to 23% in 2005. The majority of poisoning deaths were classified as unintentional drug poisonings (increasing from 60% to 75% of all poisoning deaths.)
From 1999-2005, the MVT and firearm death rates did not change significantly, but poisoning death rates increased at an average annual rate of 8.4%, see Figure 3. The unintentional drug poisoning death rate increased at an average annual rate of 11.6% per year, see Figure 6.
Ages 35-44 years-From 1999-2005, injuries increased from 29% to 33% of all deaths at ages 35-44 years. Unlike the two younger age groups, poisoning has become the leading cause of injury death in this age group, increasing from 27% of all injury deaths in 1999 to 33% in 2005. Similar to the two previous age groups, unintentional drug poisoning increased substantially as a share of all poisoning deaths from 61% in 1999 to 71% in 2005. MVT continues to be the second leading cause of injury death, accounting for about 27% of all injury deaths from 1999-2005. Firearms, the third leading cause of injury death, accounted for slightly less than 20% of all injury deaths in this age group.
Poisoning death rates increased more slowly in this age group than in the two younger age groups; from 2003-2005 the rate was unchanged at 21 deaths per 100,000 population, see Figure 4. The unintentional drug poisoning death rate, however, increased at an average annual rate of 8.5%, and the rate increased throughout the period, albeit slower during the 2003-2005 period than earlier, see Figure 6. Neither MVT nor firearm death rates changed significantly from 1999-2005.
Ages 45-54 years-From 1999-2005, injuries increased slightly to 15% of all deaths among persons 45-54 years of age. Poisoning, MVT, and firearms continue to be the three leading causes of injury death. From 1999-2005, MVT declined as a proportion of injury deaths from 25% to 21%, whereas poisoning deaths increased from 24% to 34%. In 2001, poisoning became the leading cause of injury death. Unintentional drug poisoning increased from 57% to 69% of all poisoning deaths from 1999-2005. Firearms declined as a percent of all injury deaths from 19% to 16% over the same period.
From 1999-2005 poisoning death rates increased at an average annual rate of 10.9% and unintentional drug poisoning increased at an average annual rate of 15.3%, see Figures 5 and 6. Both MVT and firearm death rates increased at an average annual rate of 1.6% per year.
Other ages
In 2005, MVT deaths were the leading cause of injury death for children 5-9 years through teenagers 15-19 years. Firearms were the second leading cause of injury death for ages 10-14 and 15-19 years. For older adults, aged 55-64 and 65-74 years, MVT deaths were the leading cause of injury death and were second to falls for those aged 75-84 years and were third after falls and suffocation among the elderly aged 85 years and older.
Conclusion
For at least the 40 years prior to 2004, the two leading causes of injury death were MVT deaths and firearms. Beginning in 2004, poisoning deaths outnumbered firearm deaths and have increased at a greater pace than firearm deaths since then. Unintentional drug poisonings are the largest component of poisoning deaths; they are primarily related to drug overdose and their rates of increase have outpaced those of all poisonings. Physicians who prescribe narcotics (e.g., opioids such as methadone or oxycodone) should be aware of the risks associated with the drugs that are contributing to these deaths. Whether the drugs are not prescribed correctly, are not taken according to the physician's directions, or are diverted from a patient to someone else cannot be ascertained, but all possibilities must be considered (3).
Data source
All data are from the National Center for Health Statistics, National Vital Statistics System. Data for 1999-2004 can be replicated on CDC's WONDER; data for 2005 have not yet been included on WONDER, but are available to the public. The authors would like to acknowledge technical assistance from Arialdi M. Minino in the Division of Vital Statistics.
References
- Minino AM, Heron MP, Murphy SL, Kochankek KD. Deaths: Final data for 2004. National vital statistics reports; vol 55 no 19. Hyattsville, MD: National Center for Health Statistics. 2007.
- Kung HC, Hoyert DL, Xu J, Murphy SL. Deaths: Final data for 2005. National vital statistics reports; vol 56 no 10. Hyattsville, MD: National Center for Health Statistics. 2008.
- Paulozzi LJ, Budnitz DS, Xi Y. Increasing deaths from opioid analgesics in the United States. Pharmacoepidemiol Drug Saf 2006; 15: 618-627.
Related Report
Increases in Poisoning and Methadone-Related Deaths: United States, 1999-2005
Figures


Page Last Modified: July 31, 2008
National Center for Health
Statistics
3311 Toledo Road
Hyattsville, MD 20782
Phone:
1-800-232-4636
cdcinfo@cdc.gov
Centers for Disease Control and Prevention, 1600 Clifton Rd, Atlanta, GA 30333, U.S.A
Tel: (404) 639-3311 / Public Inquiries: (404) 639-3534 / (800) 311-3435