Primary Navigation for the CDC Website
CDC en EspaƱol


Women's Health

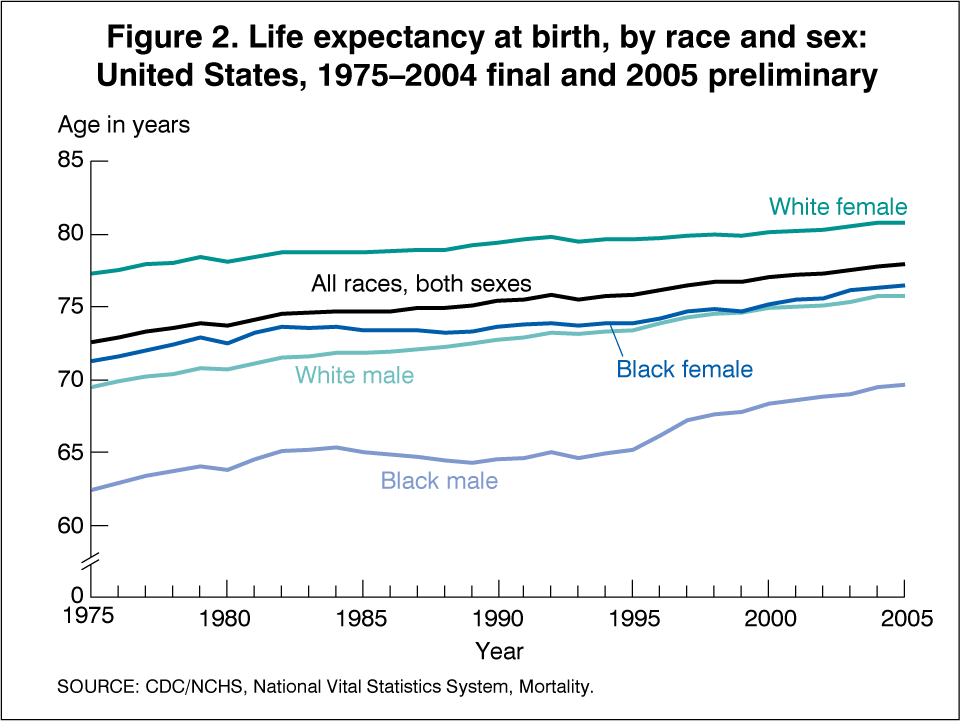
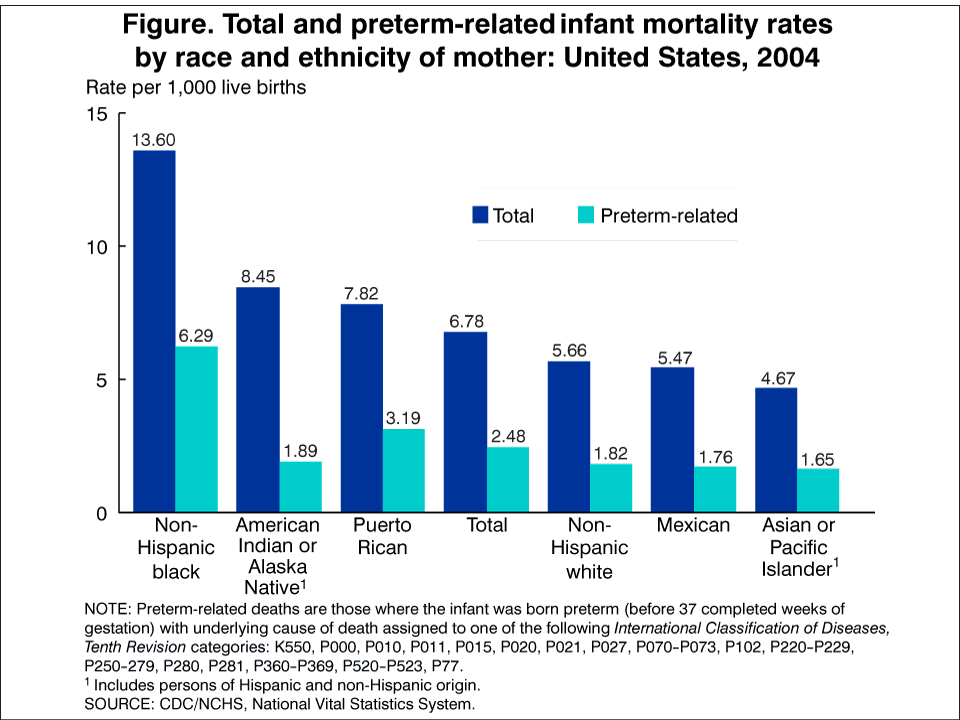
Snapshots: Figures and Tables

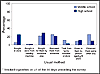
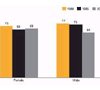
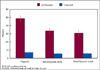
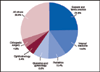
Below are selected data, figures, and tables depicting a variety of women’s health issues arranged by health topic. Click on the title or graphic for a larger image and more information. Health topics and items will be added gradually.

Aging

image QuickStats: Percentage of Adults Aged Over 65 Years Who Ever Received a Pneumococcal Vaccination, by Sex, Age Group, and Race/Ethnicity: National Health Interview Survey- United States, 2007
graph QuickStats: Annual Rate of Nonfatal, Medically Attended Fall Injuries among Adults Aged 65 Years and Older- United States, 2001-2003. National Health Interview Survey, 2001-2003.

Alcohol Use

graph Figure 9.2. Percentage of adults aged 18 years and over who had 5 or more drinks in 1 day at least once in the past year, by age group and sex: United States, January-March 2007. PDF

Arthritis

graph QuickStats: Percentage of Adults Aged 18 Years and Older Who Reported Some Form of Arthritis or a Related Condition, by Sex and Race/Ethnicity: National Health Interview Survey, United States, 2006

Cancer

image QuickStats: Age-Adjusted Death Rates for Cancer, by Race and Sex- United States, 1979-2006
graphic Top 10 Cancer Sites: Females, All Races- United States, 2004

Child and Adolescent Health

graph QuickStats: Adolescent Death Rates, by Race/Ethnicity and Sex- United States, 2001-2003. National Vital Statistics System, 2001-2003 Mortality Files: Health Data for All Ages.
graph Figure 9. Percentage of current cigarette smokers aged under 18 years in middle school and high school who obtained cigarettes, by usual methods of obtainment- National Youth Tobacco Survey, United States, 2002. Youth Tobacco Surveillance, United States, 2001-2002 PDF
graph Figure 2. Percent of never married females and males 18-19 years of age who have ever had sexual intercourse- United States, 1988-2002. Teenagers in the United States: Sexual Activity, Contraceptive Use, and Childbearing, 2002. PDF

Deaths

graph Figure 4. Probabilities of transition from good or poor health to death, by level of education- females, 2001-2002: Estimating Healthy Life Expectancies Using Longitudinal Survey Data: Methods and Techniques in Population Health Measures PDF
image QuickStats: Life Expectancy at Birth, by Race and Sex- United States, 1970-2005
graph Figure 3. Percentage of total deaths for the top five causes of death among females: 1980-2004 PDF
graph Slide 19: Trends in Annual Rates of Death due to the 9 Leading Causes among Women 25-44 Years Old, United States, 1987-2004
graph Figure 2. Life expectance at birth, by race and sex: United States, 1975-2004 final and 2005 preliminary.

Diabetes

graph Age-adjusted prevalence of diagnosed diabetes by race/ethnicity and sex, United States, 1980-2005.

Health Care

graph Figure 11.3. Percentage of persons of all ages who had excellent or very good health, by age group and sex: United States, January-March 2007. Early Release of Selected Estimates Based on Data from the January-March 2007 National Health Interview Survey PDF
graph Figure 4. Percent distribution of all-listed procedures in major categories for hospitalized patients by sex- United States, 2005: National Hospital Discharge Survey, 2005 (page 5) PDF
image Figure 2. Percentage of office-based physicians who are female, by age: United States, 2003-2004 (p. 8) PDF
graph QuickStats: Annual Rate of Visits to Office-Based Physicians and Hospital Outpatient Departments during which Combination Estrogen-Progestin Hormone Therapy was Prescribed for Women Aged 40 Years of Age and Older, by Age Group- United States, 2001-2003
graph Figure 5. Percent of women with no usual place of care (or only hospital emergency room) by race or ethnicity and insurance status- United States, 2000-2002. Access to Health Care among Hispanic or Latino Women- United States, 2000-2002. PDF
chart Figure 1. Percent distribution of office visits by physician specialty- United States, 2003. National Ambulatory Medical Care Survey: 2003 Summary. PDF

Heart Disease and Stroke

image QuickStats: Age-Adjusted Rates of Death from Heart Disease, by Race and Sex- United States, 1979-2006
image QuickStats: Mean Serum Total Cholesterol Level among Adults Aged 20 Years and Older, by Sex: National Health and Nutrition Examination Survey (NHANES)- United States, 1999-2000 to 2005-2006
image Figure 3. Prevalence of high serum total cholesterol by age and sex, United States, 2005-2006 PDF
image Figure 6. Control of hypertension among treated hypertensive adults- United States, 2005-2006 PDF

Injury

graph Figure 16. Injury Hospital Discharge Rates by Sex and Age Group, U.S., 2004-2006. Injury in the United States: 2007 Chartbook, Page 44 PDF
graph Figure 2: Age-Specific Methodone-Related Death Rates, 1999-2004

Mental Health

image QuickStats: Percentage of Adults with Symptoms of Serious Psychological Distress, by Age Group and Sex: National Health Interview Survey- United States, 2007
graph Figure 13.2. Percentage of adults aged 18 years and over who experienced serious psychological distress during the past 30 days, by age group and sex: United States, January-March 2007. Early Release of Selected Estimates Based on Data from the January-March 2007 National Health Interview Survey PDF
graph QuickStats: Rate of Hospitalization for Depression among Persons Aged 5-19 Years, by Sex- United States, 1990-1992 and 2002-2004

Overweight and Obesity

graph Figure 4. Prevalence of obesity, by age, race/ethnicity, and sex, adults aged 20 years and older- United States, 2005-2006 PDF

Pregnancy and Reproductive Health

image Figure 2. Percentage of Transfers Resulting in Live Births and Singleton Live Births for Assisted Reproductive Technology Procedures Performed among Women Who Used Freshly Fertilized Embryos from Their Own Eggs, by Patient's Age Group- United States, 2005
graph Figure 1. Percentage of infants who were ever breastfed by birth cohort- United States, 1993-2006: Breastfeeding in the United States: Findings from the National Health and Nutrition Examination Surveys, 1999-2006 PDF
graph QuickStats: Percentage of Women Who Gained Less Than 15 Pounds during Pregnancy, by Age Group and Race/Ethnicity of Mother- United States, 2005
image QuickStats: Percentage of Women Who Gained More than 40 Pounds during Pregnancy, By Race/Ethnicity of Mother- United States, 1990, 2000, and 2005
image Figure 1. Birth rates for teenagers by age: United States, final 1980-2005 and preliminary 2006 PDF
graph Figure 4. Percent distribution of outpatient department pregnancy-related visits by trimester- United States, 2005. National Hospital Ambulatory Medical Care Survey: Outpatient Department Summary, 2005 (page 5) PDF
graph Figure 4. Percentage of persons under 65 years of age without health insurance coverage at the time of interview, by age group and sex: United States, 2006. (page 3) PDF
graph QuickStats: Percentage of All Live Births by Cesarean Delivery: National Vital Statistics System- United States, 2005
graph Preterm-Related Infant Mortality by Race and Ethnicity of Mother
QuickStats: Distribution of Births, by Gestational Age- United States, 1990 and 2005
image Figure 1. Location of U.S. assisted reproductive technology clinics
graph Figure 1. Maternal mortality rates- United States, 1915-2003 (p.2) PDF
graph Figure 1: Pregnancy, Birth, and Abortion Rates for Teenagers 15-17 years
graph Figure 2: Pregnancy, Birth, and Abortion Rates for Teenagers 18-19 years
graph Figure 5. Birth rate: United States, 2000. Birth and Fertility Rates for States by Hispanic Origin Subgroups- United States, 1990 and 2000 PDF
graph Figure 1. Cesarean rates for first births and repeat cesarean rates, for all women and low-risk women- United States, 1990-2003. Trends in Cesarean Rates for First Births and Repeat Cesarean Rates for Low-Risk Women- United States, 1990-2003. PDF
graph Figure 4. Percentage distribution of women 15-44 years of age, by current contraceptive status- United States, 2002. Use of Contraception and Use of Family Planning Services in the United States, 1982-2002. PDF

Sexually Transmitted Diseases (STDs and HIV/AIDS)

graph Figure 42. Trichomoniasis and other vaginal infections in women-Initial visits to physicians' offices: United States, 1966-2006
graph QuickStats: Prevalence of HPV Infection among Sexually Active Females Aged 14-59 Years, by Age Group: National Health and Nutrition Examination Survey- United States, 2003-2004
graph Age-Adjusted Average Annual Rate of Death due to HIV Disease, by Sex and Race/Ethnicity- United States, 2000-2004
graph Race/ethnicity of women with HIV/AIDS diagnosed during 2001-2004. HIV/AIDS among Women (page 3) PDF
graph Chlamydia Rates by Sex and Age, AI/AN Non-Hispanic, 2004 PDF

Smoking and Tobacco

graph Figure 8.3. Prevalence of current smoking among adults aged 18 years and over, by age group and sex- United States, January-June 2006 PDF

Workplace Safety and Health (Occupational Health)

graph Figure 2.6. Distribution of fatal occupational injuries for male and female workers by selected causes of death, 1980-1995. Worker Health Chartbook, 2000: Fatal Injury.


PDF symbol This site contains documents in PDF format. You will need Adobe Acrobat Reader to access the file. If you do not have the Acrobat Reader, you may download a free copy from the Adobe Web site.

Content Source: CDC Office of Women's Health
Page last modified: August 7, 2008
Page last reviewed: August 7, 2008