|
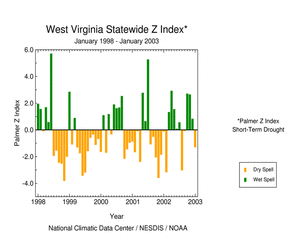
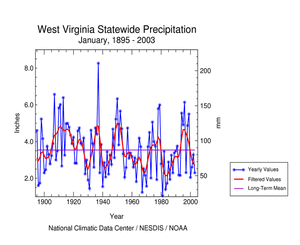
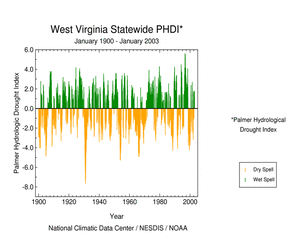
January 2003 ranked as the 23rd driest January, statewide, in the 109-year record, marking a departure from the predominantly wet conditions for the state of the last several months.
As noted by USDA Agricultural Meteorologist Brad Rippey:
               West Virginia Climate Summary, January 2003

Cold, mostly drier-than-normal weather prevailed across the Mountain State in January.  In
Parkersburg, it was the ninth-coldest (24.6oF), tenth-driest (1.42 inches) January in more
than a century of recordkeeping.  Parkersburg's January temperatures were last colder in
1994, when readings averaged 24.2oF, and January precipitation was last lower in 1986,
when just 1.32 inches fell.  Similarly, Beckley had its seventh-coldest (24.2oF), eighth-
driest (1.47 inches) January.  Beckley also recorded an average temperature of 24.2oF in
January 1985, the most recent January that was at least as cold.  Like Parkersburg, it was
Beckley's driest January since 1986.

Snow fell in several, mostly light, precipitation events.  Just across the West Virginia-
Virginia border in Blacksburg, VA, the highest daily snowfall during January was 4.0
inches on the 16th.  Even though measurable snow fell in Blacksburg on 7 January days, the
monthly total was only 8.2 inches.  Just east of West Virginia's northern panhandle,
Pittsburgh, PA, netted 18.3 inches of snow spread out across 18 days, with a maximum daily
total of 3.0 inches on January 26.  Pittsburgh's maximum snow depth reached 5 inches on
January 29 and 30.

Significantly higher snowfall totals were observed in orographically favored mountain
areas during January, despite the loss of most of the open water on Lake Erie.  The snow,
which typically occurs in part due to the lifting of Great Lakes-moistened air across the
Allegheny Plateau, totaled 83.3 inches at a co-operative observing site near Davis, WV,
located at an elevation of 3,698 feet above sea level and several hundred feet above the
Canaan Valley floor.  According to the observer, Canaan Valley's previous January snowfall
record of 64.5 inches was set in 1985, and the previous monthly snowfall record of 80.5
inches was established in February 1958.  However, according to the National Weather
Service office in Charleston, WV, the state's monthly snowfall record, 104 inches at Terra
Alta in January 1977, remained intact.

                 Preliminary Station Data, January 2003*
  Temperatures (oF), Precipitation (Inches), and Departures from Normal

Station   	Average   Departure Precipitation  Departure   Percent of Normal
Beckley   	24.2      -6.2      1.47           -1.76          46
Bluefield 	24.8      -7.9      1.58           -1.48          52
Charleston	28.2      -5.2      1.79           -1.46          55
Elkins    	22.3      -6.3      2.14           -1.29          62
Huntington	28.1      -4.6      1.38           -1.83          43
Martinsburg	26.9      -5.1      2.31           -0.42          85
Parkersburg	24.6      -6.5      1.42           -1.63          47

* Preliminary station data provided by National Weather Service offices in Blacksburg, VA,
Charleston, WV, Pittsburgh, PA, and Sterling, VA.
|
 NCDC /
Clim. Monitoring /
Climate-2003 /
Jan /
U.S. Regional Drought /
Search /
Help


