|
 NCDC / Climate Mon. / Climate-2003 / Jan / U.S. Drought / Regional Drought / Indicators / Search / Help NCDC / Climate Mon. / Climate-2003 / Jan / U.S. Drought / Regional Drought / Indicators / Search / Help

|
Climate of 2003 - January
U.S. Drought Indicators
National Climatic Data Center, 13 February 2003
|

|
Global Analysis /
Global Hazards /
United States /
U.S. Regional Drought /
U.S. Drought Indicators /
Extremes
Use these links to access detailed analyses of Global and U.S. data.

The data presented in this drought report are preliminary. Ranks, anomalies, and percent areas may change as more complete data are received and processed.
|
Several climate indicators are used to monitor drought in the United States. These indicators include:
the Palmer Z Index, Palmer Drought Severity Index, and Palmer Hydrological Drought Index
the one-month, two-month, three-month, six-month, nine-month, 12-month, and 24-month Standardized Precipitation Index
maps showing the percent of normal precipitation for airport stations for the current month and year-to-date
the statewide precipitation ranks for current month (short-term) and 3-months, 6-months, and 12 months (longer-term)
the short-term surface wetness anomaly map computed by the National Climatic Data Center from the Special Sensor Microwave Imager (SSMI), a polar orbiting satellite with global coverage

larger image
The surface wetness anomaly map shows areas of above and below average liquid precipitation wetness. During the winter months, it should be used in conjunction with the snow cover anomaly map.
|
larger image
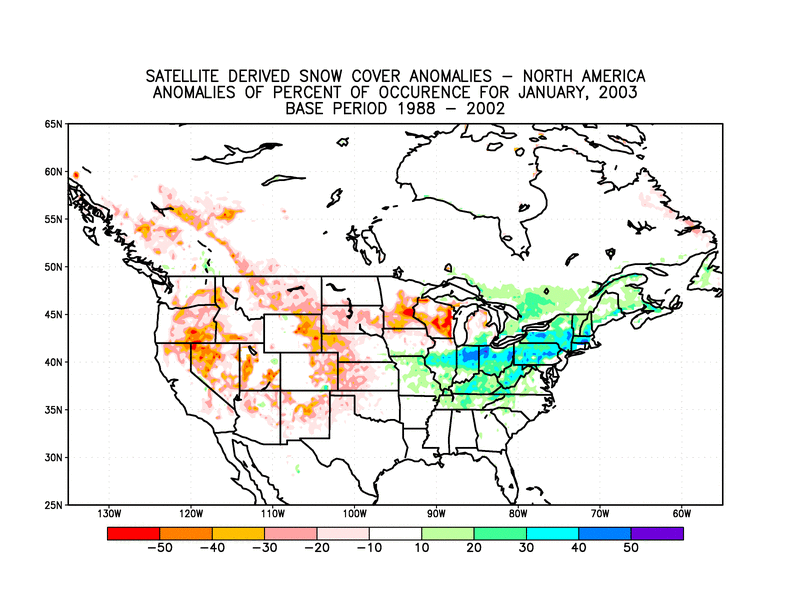
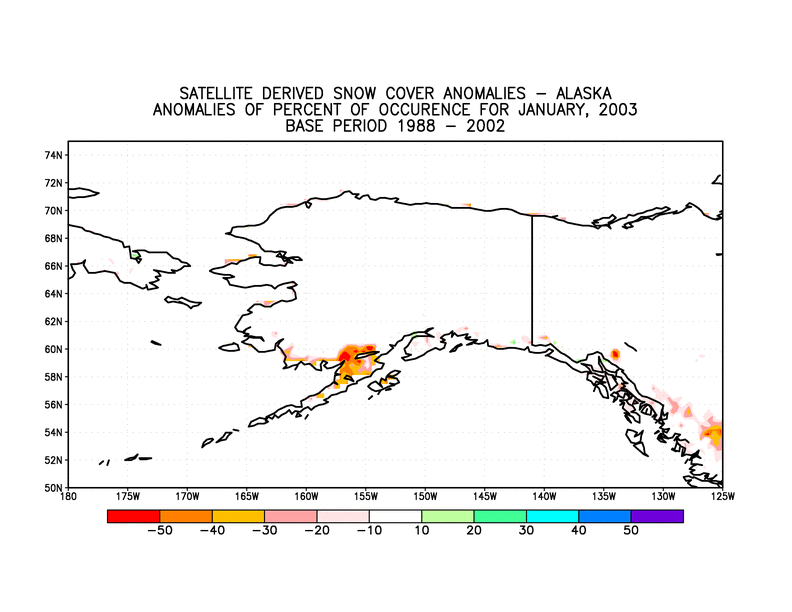
The snow cover anomaly map shows areas of above and below average frozen precipitation "wetness". An area with above-average snow cover may appear to have below-average liquid wetness.
|

larger image
The surface wetness anomaly map shows areas of above and below average liquid precipitation wetness. During the winter months, it should be used in conjunction with the snow cover anomaly map.
|
larger image
The snow cover anomaly map shows areas of above and below average frozen precipitation "wetness". An area with above-average snow cover may appear to have below-average liquid wetness.
|
modeled runoff, evaporation, and soil moisture conditions as calculated by the National Weather Service
the percent of average precipitation map for the water year to date for the SNOTEL stations in the western mountains provided by the USDA Water and Climate Center
the percent of average snow water content map for the SNOTEL stations in the western mountains provided by the USDA Water and Climate Center
the USGS January daily streamflow maps
|
 For all climate questions other than questions concerning this report, please contact the National Climatic Data Center's Climate Services Division: For all climate questions other than questions concerning this report, please contact the National Climatic Data Center's Climate Services Division:
Climate Services Division
NOAA/National Climatic Data Center
151 Patton Avenue
Asheville, NC 28801-5001
fax: 828-271-4876
phone: 828-271-4800
email: ncdc.info@noaa.gov
For further information on the historical climate perspective presented in this report, contact:
Richard Heim
NOAA/National Climatic Data Center
151 Patton Avenue
Asheville, NC 28801-5001
fax: 828-271-4328
email: Richard.Heim@noaa.gov
-or-
Jay Lawrimore
NOAA/National Climatic Data Center
151 Patton Avenue
Asheville, NC 28801-5001
fax: 828-271-4328
email: Jay.Lawrimore@noaa.gov
NCDC / Climate Mon. / Climate-2003 / Jan / U.S. Drought / Regional Drought / Indicators / Search / Help
http://www.ncdc.noaa.gov/oa/climate/research/2003/jan/drought-indicators.html
Downloaded Friday, 24-Oct-2008 21:22:20 EDT
Last Updated Friday, 18-Nov-2005 14:11:55 EST by Richard.Heim@noaa.gov
Please see the NCDC Contact Page if you have questions or comments.
|


