A guide to grid-based products and services
from the National Weather Service
What is
IFPS? The Interactive
Forecast Preparation System (IFPS),
is a software suite that the National Weather Service (NWS) began using operationally
in 2002. IFPS represents a substantial leap forward in the ability of the NWS
to provide forecast information to its customers and partners in a digital age.
In the past, weather information has been disseminated from the NWS primarily
through text based products and services. IFPS provides not only for preparation
of familiar text based products, but also creates in digital (i.e. numerical)
form a database from which a wide range of new graphical and digital forecast
products can be generated. The real advantage of IFPS then is in the power of
the digital database to provide a greater amount of forecast and weather information
in more useful forms.
NWS meteorologist no longer need to manually
type long text-based forecast products for specific user communities. With
IFPS, forecasters use a new interactive process to prepare their forecasts, storing
meteorological fields in a common digital database. The database then becomes
part of the National Digital Forecast Database (NDFD)
which serves as the foundation for countless products and services.
Currently,
the NDFD digital database includes individual forecast grids for the following
weather elements:
- Maximum temperature
- Minimum temperature
- Probability
of precipitation (POP12)
- Weather
- Sky cover
- Wind direction
and speed
- Significant wave height
- Temperature
- Dewpoint
- Precipitation amount
- Snow amount
While many of the
forecast grids are still considered experimental, a limited set have been made
official and available through the NDFD, with the addition of more official elements
planned in the near future.
How
are the forecast database grids created?
Meteorologists at each
National Weather Service office first import digital computer model and sensible
weather data into a Graphical Forecast Editor (GFE). Then, using advanced tools
and techniques within the GFE, the forecaster interactively manipulates the digital
data for each forecast element or grid. Each point on a grid represents a separate
place and time in the forecast period. Using the GFE, meteorologists assign a
value to every grid point for each different weather element, and for each time
in the forecast period. Each forecast point has a resolution of 5 km, and will
soon be upgraded to a higher resolution of 2.5 km.
 |
| Example of a
5 km grid point. Using IFPS, NWS forecasters now create forecasts for each 5 km
grid point in the U.S. | The tools
used to edit the grids are becoming increasingly sophisticated and account for
terrain and elevation changes, climatological data, and even diurnal variations
for every grid point in the forecast area. A forecaster will create one forecast
grid for each of the separate weather elements (temperature, sky cover, etc...).
When the grid editing is completed, the weather element grids are stored and transmitted
to the NDFD. Various computer programs then use the digital (gridded) database
to generate a wide range of text and graphical forecast products.
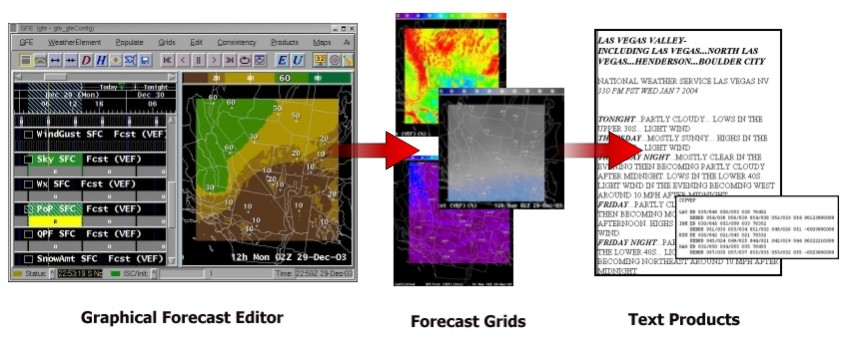
What are the advantages
of a digital forecast database? Instead of a limited set
of text based forecasts, the digital
forecast database itself is offered as a NWS product. This advantage
to NWS customers and partners is extensive. The digital database increases detail
in both time and space, provides a greater amount of forecast information, and
has the flexibility from which to create a wide range of customized text, graphical
and image products.
To illustrate the advantages, we can look at
a text product widely distributed by the NWS, the Zone Forecast Product (ZFP).
The ZFP is issued by all NWS offices and by definition is a text based product
that is used to explicitly state the weather forecast for each "zone" within a
specified forecast area. The "zone" can encompass a fairly large geographic
area necessitating generalized wording at times. In contrast, the
new digital database provides detailed hourly forecasts for any 5 km grid point
in the US and its territories. This means that, utilizing the database, users
can generate a forecast of desired weather parameters tailored to their individual
needs and location.
The difference appears very dramatic when
we compare the two products in the chart below. In the zone forecast product,
the entire Las Vegas valley is grouped into one forecast "zone". By comparison,
the new gridded database contains around 150 unique forecast points for the Las
Vegas valley!
| Information
provided in the forecast for the Las Vegas Valley in a 24 hour period |
| | Zone
Forecast Product | Gridded Database
(5 km resolution) | | Unique
Forecast Points | 1 (McCarran Intl' Airport) | about
150 | | Forecast
Weather Elements | 8 | 15 |
| Pieces of Information
provided | 8-12 | over
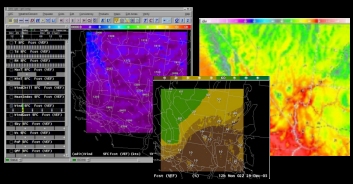
18,000 | As you can see the above chart and
from the images below, the amount of forecast data now has increased significantly!
 NWS
Las Vegas Forecast zones. In the Zone Forecast Product one forecast is issued
per zone. |
 NWS
Las Vegas gridded forecast for temperature. Each grid point is at a resolution
of 5 KM, providing a much more detailed forecast. |
There are countless applications for a national digital forecast
database. With the advent of graphical products, users can now look at visual
displays of probability. The digital data has allowed people to begin generating
their own user-specific forecasts on the internet. Private forecasters can download
the forecast grids and tailor them to their own needs. Emergency managers can
now look at graphical forecasts and determine what and where the greatest weather
threat to their responsibility area will be. The new database has already allowed
the NWS to begin developing new forecast products such as the State Forecast Table
(SFT) and the Point Forecast Matrices (PFM). Imagine, one day soon, you go to
use online mapping software and it provides you with a weather forecast for specific
points and times along your route!
What
is NDFD? Each local NWS forecast office generates a complete
digital database (grids) for their area of responsibility. Each local office's
set of grids is then collected and merged into one seemless National
Digital Forecast Database (NDFD). To ensure consistency and quality along
forecast office boundaries, weather elements are coordinated between offices using
graphical methods, computer "instant" messaging, and conference calls. The
NDFD database is made available to all customers and partners (public and private)
who can then create a wide range of text, graphic, and image products of their
own. Any individual user with a computer and access to the internet can download
information from the NDFD to suit his or her needs. In the future, watch and warning
information will be added to the NDFD.
View
national forecast graphics Download
data files
New Forecast
Products The increased amount of information available in the
digital database has allowed new text, graphical, and web-interactive products
to be developed. Until the grids in the database become official, most of the
following products should be considered experimental and may not agree with official
public forecast products (ZFP). Text Products Tabular
State Forecast Product (SFT) - 7 day tabular forecast of max temperature,
min temperature, weather, and probability of precipitation for select cities in
the forecast area. Each period is from 6 AM to 6 PM that day. Point
Forecast Matrices (PFM) - Highly detailed point forecast of weather elements
displayed in a matrix format. This format is useful for quick scanning and is
easily decodable by computers. Forecasts for included weather elements are at
3-hour, 6-hour, and/or 12-hour time intervals through day 7. A PDF guide to using
the PFM is available here. Fire
Weather Point Forecast Matrices (FWP) - This product is similar to the PFM,
but is geared towards our fire weather customers. Click on the map to get a point
forecast for selected RAWS sites within the WFO Las Vegas forecast area. Graphical
Products Flash Flood
Potential Index - This official seasonal product provides users in the WFO
Las Vegas warning area with a graphical representation of where the greatest threat
for flash flooding will be, and an index of how high the expected threat is for
the next three days. The Flash Flood Potential Index is typically available from
June through mid-September. Red
Flag Potential Index - This official product uses the forecast wind and relative
humidity grids to create a new grid representing the potential that a Red Flag
Warning will be needed. The purpose of this product is to provide land management
agencies with a graphical image of where the worst fire weather conditions are
expected for forecast days two through four. Dry
Lightning Potential Index - This experimental product provides fire weather
customers with a graphical representation of where the greatest threat for dry
lightning exists during forecast days one through three. The Dry Lightning Potential
Index is a seasonal product, and is typically available from June through mid-September.
 |  |
| Flash Flood Potential
Index (FFPI) | Red
Flag Potential Index (RFPI) | Web-Interactive
Products User-Specific
Forecasts - This feature allows anyone with internet access to generate a
detailed forecast for a specific location (5 km resolution). The user chooses
the number of days the forecast goes out, the forecast interval in hours, and
in what format they would like the data displayed. Weather
Planner - This application is designed to generate a quick preliminary planning
forecast for parameters and thresholds defined by the user. The output is a color-coded
graph representing average conditions in a 5 km grid box nearest the submitted
lat/lon point. Parameters include temperature, relative humidity, wind speed,
dewpoint, and precipitation.
The
future of IFPS Data from the NDFD will become even more useful
as the resolution and the quality of the forecast data increases. The digital
database will drive the future of all weather products and services, both from
the National Weather Service and from the private sector. An unlimited amount
of products and services, including text, graphical, and web-interactive forecasts,
will become available. Private companies will be able to use the database to provide
high-quality, user-specific products to their customers. Anyone with a home computer
and internet access will be able to download the forecast database and generate
a forecast that suits their specific needs and location. Digital data will
allow public and private users to access products and services through not only
the internet, but through a wide range of electronic devices that are quickly
becoming more integrated into each of our daily lives. These devices include cell
phones, PDA's, and TV's. The applications for the digital database are literally
endless!
|