 Main Page
 Search NEFSC
|
Status of Fishery Resources off the Northeastern US NEFSC - Resource Evaluation and Assessment Division | |||
| |||

Turn Word Definitions On
 Figure 2.1 Statistical Areas Used |
Distribution, Biology and Management
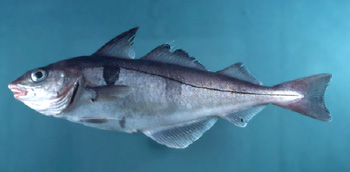
The haddock, Melanogrammus aeglefinus, is a commercially-exploited groundfish found in the northwest and northeast Atlantic Ocean. This demersal gadoid species is distributed from Cape May, New Jersey to the Strait of Belle Isle, Newfoundland in the northwest Atlantic (Collette and Klein-MacPhee 2002), where a total of six distinct haddock stocks have been identified (Begg 1998). Two of these haddock stocks are found in U.S. waters: Georges Bank and Gulf of Maine (Brodziak 2005). The Georges Bank haddock stock is found in the shallow productive waters of Georges Bank while the Gulf of Maine stock inhabits waters of the southwestern Gulf of Maine (Figure 2.1). Both stocks support important commercial fisheries (Clark et al. 1982, Brown and Munroe 2000, Brodziak et al. 2002, Brodziak et al. 2006). Commercial fishing for haddock occurs year round in U.S. waters. Otter trawl fishing gear produces the majority of haddock landings, while the remainder of the catch is taken with longlines or gill nets. Recreational catches are relatively minor and amount to roughly 1%-2% of commercial catches in recent years. Most of the recreational haddock catch is taken with hook and line gear in the Gulf of Maine region during spring to late-autumn. |
|
Adult haddock range in length
from 30 cm to up to a maximum size of about 1 meter. The largest
haddock captured in U.S. waters weighed 13.6 kg (Collette and Klein-MacPhee
2002). The oldest recorded haddock in the U.S. waters was a 17 year
old fish captured during a 1980 NEFSC research survey. Most of the
U.S. commercial haddock catch comprises age-3 to age-7 fish weighing
between 1 to 3 kg. Haddock reach sexual maturity between ages 1
to 4. In recent years, the median age of maturity for females has
been 1.8 years. Haddock spawning occurs from January to June and
peaks during February to early-April on Georges Bank, the primary
spawning area (Brodziak 2005). Haddock are primarily an offshore
groundfish and are commonly found at depths of 40 to 150 m (23 to
82 fathoms). Adult haddock can be found at temperatures of 0-13°C
but generally prefer temperatures of 2° to 9°C (36°
to 48°F). Juvenile haddock tend to occupy shallower water on
bank and shoal areas, while large adults are more commonly found
in deeper water. Adult haddock undertake seasonal movements in the
western Gulf of Maine, the Great South Channel and on the northeast
peak of Georges Bank, spending much of winter in deeper waters and
moving to shoaler waters in spring to spawn.
Adult haddock are benthic feeders. They have a diverse diet that includes gastropod and bivalve mollusks, polychaete worms, amphipods, crabs, shrimps, sea stars, sea urchins, sand dollars, brittle stars, and occasional fish eggs (Brodziak 2005). Adult haddock will sometimes consume small fishes, especially herring. Pelagic larvae and small juvenile haddock feed on phytoplankton, copepods, and invertebrate eggs in the upper part of the water column. Juvenile haddock eat small crustaceans, primarily copepods and euphausiids, as well as polychaetes and small fishes. Juveniles make a transition from pelagic to demersal habitat at ages from 3 to 5 months. Juvenile haddock are eaten by elasmobranchs (spiny dogfish and skates) and many groundfish species (cod, pollock, cusk, white hake, red hake, silver hake, goosefish, halibut, and sea raven). Gray seals also prey on haddock. Growth rates of haddock have fluctuated over the past 50 years. During the 1960s, an age-4 haddock averaged 48-50 cm (19-20 in.). During the 1980s and 1990s when stock sizes were lower, size at age increased and an age-3 fish averaged about 48-50 cm in length. In recent years growth rates have slowed, with haddock reaching 48 to 50 cm at age 4. On Georges Bank, haddock growth appears to be density-dependent, with reductions in mean lengths at age across age classes as stock size has increased in recent years (Brodziak et al. 2006). Commercial fishery mean weights at age of Georges Bank haddock during 2001-2004 were below their long-term average for all age classes, with decreases ranging from 7% to 44%. Haddock maturation rates have also changed through time. During the early 1960s, all females of age 4 and older were sexually mature and 75% of age-3 females were mature. Size at maturity of Georges Bank haddock has declined in recent years (O’Brien et al. 1993; Trippel et al. 1997). For example, median length of maturity for females was about 40 cm during 1977-1983 but declined to about 34-36 cm in the early-1990s. Since 1998, virtually all age-3 females and 50% of age-2 females are mature (Brodziak et al. 2006). Although earlier maturation will increase spawning stock biomass, the actual reproductive success of first-spawning haddock has not been documented. Haddock are highly fecund broadcast spawners that spawn over rock, gravel, sand, or mud bottom. An average-sized female (55 cm, 22-in.) produces approximately 850,000 eggs. Larger females are capable of producing up to 3 million eggs annually. Haddock spawning is concentrated on the northeast peak of Georges Bank. The western edge of Georges Bank also supports a smaller spawning concentration (Walford 1938). The two spawning components are persistent and exhibit phenotypic differences in otolith morphometrics (Begg et al. 2000). Spawning concentrations also occurred historically along the Maine coast. Females release eggs near the ocean bottom in batches where they are fertilized by a courting male. After fertilization, haddock eggs become buoyant and rise to the surface water layer where they drift with ocean currents. Juvenile haddock are pelagic for 3-5 months after hatching and settle to the bottom at a size of roughly 10 cm. The U.S. fishery for haddock is managed by the New England Fishery Management Council under the Northeast Multispecies Fishery Management Plan (FMP). Haddock are jointly managed with a complex of 15 groundfish species under this FMP (NEFMC 2003). Management measures have included fishing area closures, gear restrictions, trip limits, and minimum size limits. Since 1994, direct fishing effort controls have been in place including a moratorium on permits and days-at-sea restrictions under Amendments 5 and 7 to the FMP. Amendment 9 to the FMP established initial biomass rebuilding targets and a harvest control rule to specify target fishing mortality rates. In May 2004, Amendment 13 to the FMP was implemented. Amendment 13 implemented formal rebuilding plans for New England groundfish stocks, including haddock, based on revised biomass and fishing mortality targets derived by the Working Group on Re-evaluation of Biological Reference Points for New England Groundfish (NEFSC 2002). The overall goal of Amendment 13 is to reduce fishing mortality to rebuild depleted groundfish stocks to target biomasses. In addition, a formal quota sharing agreement between Canada and the U.S. was implemented in 2004 to share the harvest of haddock in the transboundary eastern Georges Bank haddock management unit. This agreement includes total allowable catch quotas for each country as well as in-season monitoring of the U.S. catch of haddock on eastern Georges Bank. The Canadian fishery on Georges Bank is managed under an individual quota system. Total commercial haddock landings (U.S. and Canada) from the Georges Bank and Gulf of Maine stocks increased to 22,032 mt in 2005, a 18% increase from 18,604 mt in 2004. The 2005 haddock catch is the highest total catch since 1983 (19,606 mt) and almost 9-fold greater than the record low of 2,533 mt in 1995. U.S. commercial haddock landings decreased to 7,542 mt in 2005, down 14% from 8,766 mt in 2004. Despite recent increases in haddock yields, current landings are less than 1/3 of the long-term potential yield of the combined Gulf of Maine and Georges Bank haddock stocks. The information provided herein reflects the results of the most recent peer-reviewed assessments for the Gulf of Maine and Georges Bank haddock stocks (Brodziak and Traver 2005, Brodziak et al. 2006).
|

GULF OF MAINE HADDOCK The Fishery The total commercial fishery landings of Gulf of Maine haddock were 1,435 mt in 2005, a 41% increase from 1,021 mt in 2004 (Table 2.1, Figure 2.2 [Fig 2.2 Data]). Annual commercial landings averaged 1,200 mt during 2001-2005; this was the highest 4-year average since the mid-1980s. Although commercial landings of Gulf of Maine haddock have increased since the mid-1990s, they are less than one-quarter of the long-term potential yield (5,100 mt) (NEFSC 2002) and below historic yields realized during the 1950s-1960s and early-1980s (Figure 2.2 [Fig 2.2 Data]). Recreational fishery landings of Gulf of Maine haddock totaled 240 mt in 2005, a 2% increase from 235 mt in 2004 (Table 2.1). Prior to 2000, recreational landings were a relatively minor component of the Gulf of Maine haddock yield. Since 2001, recreational fishery catches have increased to average 204 mt per year and have ranged from 12% to 19% of the total annual yield. Research Vessel Survey Indices The NEFSC autumn bottom trawl biomass index is used to track the relative abundance of the Gulf of Maine haddock stock (Figure 2.3 [Fig 2.3 Data]). The NEFSC spring survey biomass index exhibits similar trends but is less responsive to changes in haddock abundance in the Gulf of Maine region. The relative abundance of Gulf of Maine haddock decreased from the late-1970s through early-1990s. The NEFSC autumn survey biomass index declined from 1978 to a record low in 1992 (0.1 kg per tow). Biomass increased to a peak of 14.0 kg/tow in 2000 and has declined to about half that level in 2004 (Figure 2.3 [Fig 2.3 Data]). The 2005 biomass index (3.9 kg/tow) is roughly 1/5 of the target biomass of 22.2 kg/tow.. NEFSC autumn survey number per tow at age indices track changes in the age composition of the Gulf of Maine haddock stock through time (Figure 2.4 [Fig 2.4 Data]). Relative abundance was high in the 1960s, in part due to the strong 1962 and 1963 year classes. Relative abundance declined in the early 1970s as the stock was overfished and recruitment declined. Stock size at age increased briefly in the late-1970s due to improved recruitment, particularly the strong 1975 and 1976 year classes. Relative abundance at age declined again in the early-1980s and reached a record low in 1991. Since then, recruitment has improved and relative abundance has increased, in part due to the recruitment of the strong 1998 year class. In 2000, the total autumn survey number per tow index (16.6 fish per tow) was at the highest level observed since 1965. While the total number per tow index has since declined to 5.7 fish per tow in 2004, the current relative abundance at age indices are 10-fold higher than when the stock collapsed in the early-1990s. |
|


|
|
Assessment
Results
The status of the Gulf of Maine haddock stock is assessed based on research vessel survey indices and commercial landings (Brodziak and Traver 2005). Overfishing status is evaluated using a fishing mortality rate index calculated as the ratio of annual commercial landings (in weight) to the 3-year average of the NEFSC autumn survey biomass index (NEFSC 2002). Overfishing occurs when the fishing mortality index exceeds FMSY=0.23. Fishing mortality (F) on Gulf of Maine haddock fluctuated between 0.08 and 0.34 during 1963-1976 (Figure 2.5 [Fig 2.5 Data]). F subsequently increased to a peak of 1.22 in 1983 and then declined to a low of 0.17 in 1989. F increased again to over 0.85 during 1991-1994 but has since decreased and has remained lower than FMSY since 2000. In 2004, the fishing mortality index was F=0.18. The Gulf of Maine haddock stock is classified as overfished when the 3-year average NEFSC autumn biomass index falls below 11.1 kg per tow, which is one-half of the BMSY proxy of 22.2 kg per tow (Brodziak and Traver 2005). Stock biomass was above the overfished threshold in the 1960s but eventually declined in the late-1960s and the stock was in an overfished condition in 1971 (Figure 2.6 [Fig 2.6 Data]). The stock remained overfished until 1978 when the strong 1975-1976 year classes recruited to the fishery. Stock biomass remained above the overfished threshold for 2 years and subsequently declined. The stock has been in an overfished condition since 1981. In 2004, the biomass index was 5.8 kg per tow, roughly 26% of the BMSY target. |


Recruitment
of Gulf of Maine haddock, as indexed by the NEFSC autumn survey,
has been intermittent since the 1960s (Figure
2.6 [Fig
2.6 Data]). Two strong year classes were produced in the early-1960s
(the 1962 and 1963 year classes). Recruitment then declined and
remained low until the 1970s when several strong year classes appeared.
Recruitment declined again in the 1980s and remained low until the
late-1990s when the strong 1998 year class was produced. Since 2000,
recruitment has again decreased to low levels. In particular, the
abundance of the 2003 year class of Gulf of Maine haddock appears
to be average, in contrast to the exceptional abundance of the 2003
year class of Georges Bank haddock.
Biological Reference Points Biological reference points for the Gulf of Maine haddock stock were determined by the Working Group on Re-evaluation of Biological Reference Points for New England Groundfish (NEFSC 2002). The Working Group used catch and survey data from the 2001 assessment to estimate survey-based proxies for MSY-based reference points (Table 2.2). These estimates were: MSY=5,100 mt, BMSY=22.2 kg per tow using the 3-year average of the NEFSC autumn survey biomass index, and FMSY=0.23 thousand mt/kg per tow using the 3-year average of the NEFSC autumn survey biomass index. Summary
Although Gulf of Maine haddock abundance has increased since the mid-1990s, stock biomass remains low in comparison to BMSY. Fishing mortality on Gulf of Maine haddock has remained below FMSY since 2000 although F increased in 2003-2004. Overall, the Gulf of Maine haddock stock remains in an overfished condition although overfishing is not currently occurring. |
| GEORGES BANK HADDOCK | |
|
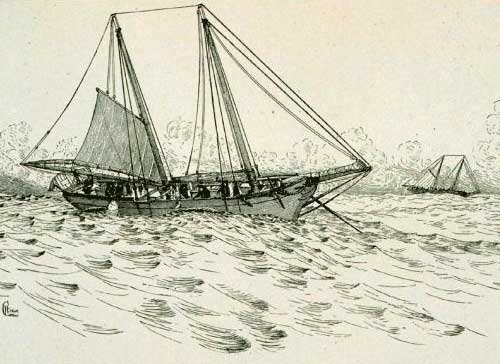
The Fishery The Georges Bank haddock stock has been commercially exploited since the 19th century with reliable landings statistics available beginning in 1904 (Figure 2.7 [Fig 2.7 Data]). Since then, the fishery for Georges Bank haddock has gone through seven periods: (1) the initial expansion from 1904-1923 when annual landings averaged 17,400 mt; (2) the rapid expansion and decline during 1924-1930 when landings averaged 73,200 mt; (3) the thirty-year period of fishery stability during 1931-1960 when annual landings averaged 46,300 mt; (4) the rapid expansion and decline during 1961-1968 when landings averaged 73,000 mt and foreign distant water fleets began to harvest the resource; (5) the pre-Hague line fishery during 1969-1984 when landings averaged about 13,500 mt; (6) the fishery nadir during 1985-2000 when landings averaged only 5,600 mt (Table 2.3); and (7) the nascent recovery from 2001-2005 when annual landings have increased to average 15,000 mt per year (Table 2.3). Landings have generally increased each year since 1995 as the stock has been rebuilding under restrictive management measures. In 2005 total commercial landings were 20,597 mt, almost 9-fold larger than the lowest recorded landings in 1995. U.S. landings in 2005 were 6,107 mt, a 21% decrease from 7,746 mt in 2004. The U.S. fishery accounted for approximately 30% of the total Georges Bank haddock landings in 2005. The commercial fishery landings of Georges Bank haddock has been primarily composed of age-3 and older fish (Figure 2.8 [Fig 2.8 Data]). During the 1960s, the exceptional 1963 and strong 1962 year classes dominated the commercial fishery while the strong 1975 and 1978 year classes dominated catches in the late-1970s to early-1980s. In recent years, the strong 1998 and 2000 year classes have produced the majority of the fishery yield in each subarea of Georges Bank (Figure 2.1) Research Vessel Survey Indices Fishery-independent research
survey data provide relative abundance indices for the Georges Bank
haddock stock from the 1960s to the present. The NEFSC spring and
autumn biomass indices exhibit similar trends through time (Figure
2.9 [Fig
2.9 Data]). Both indices show the long-term decline in
stock biomass that has occurred since the 1960s. Both spring and
autumn indices both increased in the mid-1970s due to the strong
1975 and 1978 year classes and then declined in the early 1980s.
Autumn indices declined from record highs in the 1960s to low levels
in the early-1970s. The NEFSC autumn survey index series averaged
53 kg/tow during 1963-1968, declined to15 kg/tow during 1969-1984,
and declined further to 6 kg/tow during 1985-2000. Similarly, the
NEFSC spring survey index series averaged 19 kg/tow during 1968-1984
and then declined by more than 50% to an average of 8 kg/tow during
1985-2000. Both spring and autumn survey indices have increased
in recent years as stock biomass has begun to rebuild. Since 2001,
the autumn survey index has averaged 35 kg/tow while the spring
index has averaged 21 kg/tow. |
 Figure 2.10 |


|
The NEFSC autumn catch per tow at
age shows how the age composition of the Georges Bank haddock
stock has changed since 1963 (Figure
2.10 [Fig
2.10 Data]). In the mid-1960s, the age structure
included a full range of age groups and was dominated by the 1963
year class. In the late-1960s to early-1970s the stock collapsed
due to overfishing which led to an absence of older fish and low
recruitment (Figure
2.10 [Fig
2.10 Data]). The stock rebounded in the late-1970s
due to the recruitment of the strong 1975 and 1978 year classes.
Subsequently stock abundance declined and recruitment decreased
in the 1980s. By the early-1990s, the age structure of the stock
was truncated and included few fish of age-4 and older. In the
late-1990s, stock size began to increase at low fishing mortality.
Since then, the stock has been rebuilding and the current age
composition is dominated by the exceptional 2003 year class (Figure
2.10 [Fig
2.10 Data]). |
|
|
Assessment
Results
Fishing mortality on Georges Bank haddock has changed substantially since the 1970s (Brodziak et al. 2006). Fishing mortality fluctuated around 0.4 during the early-1970s (Figure 2.11 [Fig 2.11 Data]). F declined to less than F=0.13 during 1974-1976 but increased again in the mid-1970s. and remained above the overfishing threshold FMSY=0.26 during 1979-1994. F increased over 5-fold in the mid-1980s and averaged 0.35 during 1985-1994. F declined to one-half FMSY in 1995 coincident with the imposition of restrictive fishery management measures. Since 1995, fishing mortality has remained below the overfishing threshold although F has increased 33% from F=0.18 in 2001 to F=0.24 in 2004. Georges Bank haddock spawning biomass also changed substantially over the past several decades (Figure 2.12 [Fig 2.12 Data]). Spawning biomass peaked in the 1960s averaging 132 kt during 1963-1968, declined to a near-record low of 15 kt in 1973, and averaged only 27 kt during 1969-1974. Spawning biomass increased moderately to average 48 kt during 1975-1984 and then declined again, averaging only 23 kt during 1985-1994, with a record low of 14.6 kt in 1993. During the mid-1990s, spawning biomass increased. Since 2001 spawning biomass has approached levels observed in the 1960s and averaged 115 kt during 2001-2004. Spawning biomass increased by 22% from 96 kt in 2001 to 117 kt in 2004. Georges Bank haddock recruitment (stock size at age 1) fluctuated substantially during 1963-2005 ranging from a low of 0.3 million age-1 fish in 1971 to a high of 789 million in 2003 (Figure 2.12 [Fig 2.12 Data]). Recruitment during 1963-1968 averaged 117 million fish and was dominated by the exceptional 1963 year class (462 million age-1 fish). Recruitment declined to average only 8 million fish during 1969-1974, but subsequently increased and averaged 26 million fish during 1975-1984, primarily due to the strong 1975 (106 million) and 1978 (84 million) year classes. Recruitment averaged only 8 million fish during 1985-1994, but increased to average 22 million fish during 1995-2000. Since 2001, recruitment has averaged 179 million fish. In particular, the 1998 (47 million) and 2000 (91 million) year classes are strong, while the 2003 year class (789 million) currently appears to be one of the largest observed. Biological Reference Points Yield and spawning biomass per recruit and MSY-based reference points for Georges Bank haddock were last derived by the Working Group on the Re-evaluation of biological Reference Points for New England Groundfish (NEFSC 2002). These reference points have used in all stock assessments since 2002 (Brodziak et al. 2002, Brodziak et al. 2006). The Working Group used analytical results from the 2001 assessment to estimate these reference points (Table 2.4, Figure 2.13 [Fig 2.13 Data]). The yield and spawning biomass per recruit estimates were: F0.1 = F40% = 0.26, and FMAX>1. The MSY-based reference points were: MSY = 52,900 mt, BMSY = 250,300 mt, and FMSY = 0.26. For the purpose of stock status determination, the overfished threshold for Georges Bank haddock is BTHRESHOLD = ½ BMSY = 125,200 mt, while the overfishing threshold is FTHRESHOLD = FMSY = 0.26. Analyses of stock-recruitment data (Figure 2.14 [Fig 2.14 Data]) indicate that spawning stock size affects recruitment of Georges Bank haddock (Brodziak and Legault 2005; Brodziak et al. 2001, NEFSC 2002). For example, Brodziak et al. (2001) found that when spawning stock biomass is above 82 kt, the odds of recruitment being above average is 20 times greater than when biomass is below 82 kt and the average year class size is 5-fold higher. Thus, recruitment is higher, on average, when spawning biomass exceeds a threshold value. The Working Group on the Re-evaluation of Reference Points for New England Groundfish determined that an appropriate productivity threshold for Georges Bank haddock was 75 kt of spawning biomass (Figure 2.14 [Fig 2.14 Data]). Above this threshold, average recruitment is 96 million age-1 fish while below this threshold averagerecruitment is about 21 million fish. When spawning biomass is above 75 kt, the odds of achieving recruitment above the 1931-2005 median value are 23 times greater than when spawning biomass is below 75kt. |


|
Survival ratios of Georges Bank
haddock, as indexed by recruitment per spawning biomass, fluctuated
about an average of 0.72 recruits per kg (R/S) during 1931-2004
(Figure
2.15 [Fig
2.15 Data]). Survival ratios averaged 0.77 R/S during 1931-1960
when spawning biomass averaged 102 kt. Since then survival ratios
have declined 12% on average to 0.68 R/S with a standard error of
0.18 during 1961-2004 when spawning biomass averaged 64 kt. Since
1961, three strong year classes 1963, 1975, and 2003) have had survival
ratios of roughly 3 or higher (Figure
2.15 [Fig
2.15 Data]). Each of these year classes experienced very high
survival during early life history stages, suggesting the influence
of favorable environmental conditions in inducing large recruitment
events. Spawning biomass also affects survival ratios as survival
ratios average 0.82 when spawning biomass is above 75 kt in comparison
to only 0.59 (-28%) when spawning biomass is below 75 kt.
Summary The response of the Georges Bank haddock to reductions in fishing mortality during the 1990s was marked. Under persistent overfishing in the 1980s, spawning biomass declined from 67,400 mt in 1980 to only 14,600 mt in 1993. Since 1994, spawning biomass has increased substantially as fishing mortality has declined. However, even though stock size has increased substantially in recent years, the Georges Bank haddock stock is still in an overfished condition since spawning biomass in 2004 was only 116,800 mt (93% of BTHRESHOLD), less than half of the rebuilding target. Fishing mortality in 2004 was 0.24 (92% of FTHRESHOLD) and as a result, overfishing is not occurring on the Georges Bank haddock stock. Prospects remain positive for continued high recruitment as spawning biomass is currently above the 75 kt threshold. Recent U.S. and Canadian assessments and research survey data suggest that the 2003 year class is exceptionally abundant. This year class has the potential to rebuild the stock to BMSY in a few years if fishing mortality remains below FMSY. If the recent increases in recruitment and survival can be sustained, it is possible that historic yields on the order of 50,000 mt per year can be attained. |
Table 2.4 Summary of yield, spawning biomass per recruit and MSY-based reference points for Georges Bank haddock.
| ||||||||||||||||||||||||||||||||||||||||||||||||||||||||||||||||||||||||||||||||||||||||||||||||||||||||||||||||||||||||||||||||||||||
For further information Begg, G.A. 1998. A review of stock identification of haddock, Melanogrammus aeglefinus, in the northwest Atlantic Ocean. Mar. Fish. Rev. 60: 1-15. Begg, G.A., W.J. Overholtz, and N.J. Munroe. 2000. The use of internal otolith morphometrics for identification of haddock (Melanogrammus aeglefinus) stocks on Georges Bank. Fish. Bull. (U.S.) 99: 1-14. Brodziak, J. K. T., W. J. Overholtz, and P. J. Rago. 2001. Does spawning stock affect recruitment of New England groundfish? Can. J. of Fish. Aquat. Sci. 58:306-318. Brodziak, J., M. Thompson, and
R. Brown. 2002. Georges Bank haddock. In NEFSC, Assessment of 20
northeast groundfish stocks through 2001, pp. 36-59. Northeast Fisheries
Science Center Ref. Doc. 02-16, 509 p. Brodziak, J. 2005. Essential fish habitat source document: Haddock, Melanogrammus aeglefinus, life history and habitat characteristics, 2nd edition. NOAA Tech Mem. NMFS-NE-196, 74 pp. Brodziak, J. K. T., and C. Legault. 2005. Model averaging to estimate rebuilding targets for overfished stocks. Can. J. Fish. Aquat. Sci. 62:544-562. Brodziak, J. and M. Traver. 2005. Gulf of Maine haddock. In: Northeast Fisheries Science Center. 2005. Assessment of 19 Northeast groundfish stocks through 2004: a report of the Groundfish Assessment Review Meeting (2005 GARM), Northeast Fisheries Science Center, Woods Hole, Massachusetts, 15-19 August, 2005. Northeast Fisheries Science Center Ref. Doc. 05-13. p. 415-423. Brodziak, J., M.Traver, L. Col, and S. Sutherland. 2006. Stock assessment of Georges Bank haddock, 1931-2004. Northeast Fisheries Science Center Ref. Doc. 06-11, NEFSC, Woods Hole, MA 02543. Brown, R. W., and N. J. Munroe. 2000. Stock assessment of Georges Bank haddock, 1931-1999. Northeast Fisheries Science Center Ref. Doc. 00-12, NEFSC, Woods Hole, MA 02543. Clark, S. H., W. J. Overholtz, and R. C. Hennemuth. 1982. Review and assessment of the Georges Bank and Gulf of Maine haddock fishery. J. Northw. Atl. Fish. Sci. 3:1-27. Collete, B. B., and G. Klein-MacPhee (Editors). 2002. Bigelow and Schrodeder’s Fishes of the Gulf of Maine. 3rd Edition. Smithsonian Institution Press, Washington, D.C. [NEFMC] New England Fishery Management Council. 2003. Final amendment 13 to the Northeast Multispecies Fishery Management Plan including a final supplemental environmental impact statement and an initial regulatory flexibility analysis. NEFMC. [Newburyport, MA] 1659 p. NEFSC. 2002. Final report of the working group on re-evaluation of biological reference points for New England groundfish. Northeast Fisheries Science Center Ref. Doc. 02-04. 249 p. O’Brien, L., J. Burnett, and R.K. Mayo. 1993. Maturation of nineteen species of finfish off the northeast coast of the United States, 1985 1990. NOAA Tech. Rep. NMFS 113. 66 p. Trippel, E.A., M.J. Morgan, A. Frochet, C. Rollet, A. Sinclair, C. Annand, D. Beanlands, and L. Brown. 1997. Changes in age and length at sexual maturity of northwest Atlantic cod, haddock and pollock stocks, 1972-1995. Can. Tech. Rep. Fish. Aquat. Sci. 2157. 120 p. Walford, L.A. 1938. Effects of currents on distribution and survival of the eggs and larvae of the haddock (Melanogrammus aeglefinus) on Georges Bank. Bull. U.S. Bur. Fish. 49(20): 1 73. |
Return to Status of Fishery Resources off
the Northeastern US
www.nefsc.noaa.gov
Search
Link Disclaimer
webMASTER
Privacy Policy
(Modified Apr. 12 2007)