 Main Page
 Search NEFSC
|
Status of Fishery Resources off the Northeastern US NEFSC - Resource Evaluation and Assessment Division | |||
| |||

|
|
Distribution,
Biology and Management
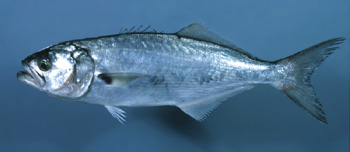
The bluefish, Pomatomus saltatrix, is a migratory, pelagic species found throughout the world in most temperate coastal regions, except the eastern Pacific. Bluefish may reach ages of 12 years and sizes in excess of 100 cm (39 in.) and 14 kg (31 lb) (Collette and Klein-MacPhee 2002). Along the U.S. Atlantic coast, bluefish are found from Maine to Florida and mix extensively during seasonal coastal migrations (Figure 25.1). During winter, large bluefish tend to remain in the Middle Atlantic Bight, moving south to North Carolina by March. Small fish move farther south in winter with some fish wintering off the coast of Florida. As water temperatures increase, the spring migration north begins and spawning occurs in the South Atlantic Bight at this time. By summer, bluefish move north into the Middle Atlantic Bight, although some medium size fish may remain off Florida (Shepherd et al. 2006). A second spawning occurs in the offshore waters of the Middle Atlantic Bight during summer. |
|
The result of these two spawning events is
the appearance of two distinct size groups of juvenile bluefish
during autumn; a spring spawned cohort having fish about 15-25
cm in length and a summer spawned cohort having fish about 4-14
cm in length (Able and Fahay 1998). Fish from the two spawning
cohorts mix extensively during the year and constitute a single
genetic stock (Graves et al. 1992). Bluefish are voracious predators,
feeding primarily on squid and fish, particularly menhaden and
smaller fish such as silversides (Buckel et al. 1999, Fahay
et al. 1999).
Bluefish are managed under a joint management plan collaboratively developed by the Mid-Atlantic Fishery Management Council and the Atlantic States Marine Fisheries Commission and implemented in 1990. The management measures presently include an overall annual landings quota in which 17% of the quota is allocated to the commercial fishery and 83% is allocated to the recreational fishery. The total commercial quota is divided into state specific quotas, and there may be a transfer of a portion of the recreational quota to the commercial sector if predicted recreational landings are below the annual allocation. | |

|
The Fishery
Most of the recreational catch of bluefish is taken in the Middle Atlantic states (New York to Virginia). Historically, the recreational fishery has accounted for 80 to 90% of the total catch, and recreational landings peaked in 1981 and 1985 at over 43,000 mt (Figure 25.2 [Fig 25.2 Data]). Recreational landings have averaged over 19 thousand mt since 1982, but have been under 8,000 mt since 1995, and were 6,900 mt in both 2004 and 2005. Total numbers of bluefish caught and released in the recreational fishery has increased steadily since 1981. During 1981-1983, fishermen released an average of 18% of the bluefish caught, whereas during 2002-2004 63% of the bluefish caught were released. The commercial fishery for bluefish operates primarily in the Middle and South Atlantic regions. Gillnets are the principal gear used and account for approximately 40% of landings. Other gear used include hook and line, pound nets, seines, and trawls. Commercial landings ranged from 1,000 to 2,000 mt during the 1950s and 1960s,increased during the 1970s and 1980s, peaking at 7,466 mt in 1981, and then declined throughout the 1990s reaching a low of 3,300 mt in 1999 (Figure 25.2 [Fig 25.2 Data]). Landings in 2005 were 3,500 mt (Table 25.1). Research Vessel Survey Indices Assessment Results
Average fishing mortality peaked at 0.46 in 1987 and has since steadily declined to 0.15 in 2004 (Figure 25.5 [Fig 25.5 Data]). Stock abundance declined steadily between 1983 and 1993 from 175.6 million fish in1982 to 58.4 million in 1993 where it remained stable for the next five years (Figure 25.5 [Fig 25.5 Data]). Since 1998, abundance has slowly increased, reaching 105.4 million in 2003 but declined to 92.3 million in 2004. Biomass peaked in 1982 at 229,000 mt, declined to 64,700 mt in 1997 and have since increased to 104,100 mt in 2004 (Figure 25.6 [Fig 25.6 Data]). The bluefish assessment was reviewed by a Stock Assessment Review Committee in June 2005 and the review concluded that the assessment results were uncertain and should be used with caution (NEFSC 2005). Biological Reference Points
Fishing mortality and spawning stock biomass biological reference points in the Bluefish FMP were based on a general surplus production model which has since been considered technically inappropriate by the SARC (SARC 39 report). New biological reference points based on the 2005 stock assessment were recommended as Fmsy = 0.19 and Bmsy = 147,052 mt (Table 25.2). |
|


Summary
The Bluefish fishery management
plan was implemented in 1990 to halt the decline of the stock
and restore the population to sustainable levels. The stock has
been increasing but is still below the target biomass. Since the
2004 estimate of fishing mortality was 0.15, the stock was not
experiencing overfishing (Figure
25.5 [Fig
25.5 Data]). Biomass below ½ Bmsy (i.e.
below 73,526 mt) defines an overfished stock under the current
management plan. Since biomass in 2004 was estimated as 104,136
mt, the stock was not in an overfished condition (Figure
25.6 [Fig
25.6 Data]) (NEFSC 2005). Cycles of low and high abundance
of bluefish follow a pattern that seems to be the converse of
striped bass, another popular target of recreational fishermen.
Several recent studies have examined potential causes of this
pattern and have found no biological explanations (Buckel and
McKown 2002.). Ongoing research continues on bluefish population
dynamics and recruitment patterns along the Atlantic coast. |
 |
For further information Able, K.W., and M.P. Fahay. 1998. The First Year in the Life of Estuarine Fishes in the Middle Atlantic Bight. Rutgers University Press. New Brunswick, NJ. Buckel, J.A., M.J. Fogarty, and D.O. Conover. 1999. Foraging habits of bluefish, Pomatomus saltatrix, on the U.S. east coast continental shelf. Fish. Bull. 97:758-775. Buckel, J.A., and K.A. McKown. 2002. Competition between juvenile striped bass and bluefish: resource partitioning and growth rate. Mar. Ecol. Prog. Ser. 234:191-204. Collette, B.B., and G. Klein-MacPhee (ed.). 2002. Bigelow and Schroeder’s Fishes of the Gulf of Maine. 3rd edition. Smithsonian Inst. Press. Washington, D.C. 748 p. Fahay, M.P., P.L. Berrien, D.L. Johnson, and W.W. Morse. 1999. Essential Fish Habitat Source Document: Bluefish, Pomatomus saltatrix, Life History and Habitat Characteristics. NOAA Technical Memorandum, NMFS-NE-144, 78 p. Graves, J.E., J.R. McDowell, A.M. Beardsley, and D.R. Scoles. 1992. Stock structure of the bluefish Pomatomus saltatrix along the Mid-Atlantic coast. Fishery Bulletin 90: 703-710. Munch, S.B., and D.O. Conover. 2000. Recruitment dynamics of bluefish (Pomatomus saltatrix) from Cape Hatteras to Cape Cod, 1973-1995. ICES J. Mar. Sci. 57(2): 393-402. Northeast Fisheries Science Center. 2005. 41st Northeast Regional Stock Assessment Workshop (41st SAW): 41st SAW Assessment Report. Northeast Fisheries Science Center Reference Document 05-14. Shepherd, G. R., J. Moser, D. Deuel, and P. Carlsen. 2006. The migration pattern of bluefish (Pomatomus saltatrix) along the Atlantic coast determined from tag recoveries. Fish. Bull. 104(4):559-570. Shepherd, G.R., and D.B. Packer. 2006. Essential Fish Habitat Source Document: Bluefish, Pomatomus saltatrix,Life History and Habitat Characteristics, 2nd Edition. NOAA Technical Memorandum, NMFS-NE-198, 89 p. |