Skip all navigation and jump to content Jump to site navigation Jump to section navigation.
NASA Logo - Goddard Space Flight Center + Visit NASA.gov
HOME PROJECTS RESOURCES SEARCH MAP

+ Advanced Search
Home
Home
View Most Recently Released Imagery
View Gallery of Imagery: A topical collection of SVS Imagery
Search Imagery by the keywords assigned to it
Search Imagery by the instruments that supplied data for a visualization product
Search Imagery by the series of visualizations that have been produced
Search Imagery by the scientist providing the data used in a visualization product
Search Imagery by the animator that created the product
Search Imagery by the identification number assigned to the visualization product
See other search options
Learn about the SVS Image Server
  + About the Server
  + Animation List
  + How to Use the Server


  + RSS Feeds
blank image
Previous Animation
Next Animation
Aqua MODIS Sea Surface Temperature Progression during Hurricane Katrina

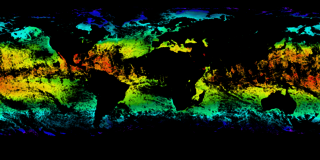
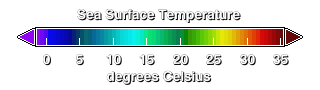
The Aqua satellite orbits the Earth every 99 minutes in a polar, sun-synchronous orbit. The MODIS instrument on Aqua observes reflected light from the Earth in 36 spectral frequencies. These observations can be processed to show many properties of the Earth's surface, from temperature and phytoplankton measurements near the surface of the ocean to fire occurrences and land cover characteristics on the land surface.

This animation shows MODIS sea surface temperature data from about 4 days of individual Aqua orbits. Sea surface temperature can only be measured by MODIS in ocean regions that are free of both clouds and sun glint, the bright band of specular reflection in the center of each granule. For this animation the data is accumulated and so builds up a complete picture of the surface of the Earth except around the South Pole, which is in darkness during the entire 4-day period.


Four days of accumulating Aqua MODIS sea surface temperature swaths during the period of Hurricane Katrina, from August 27, 2005 through August 30, 2005.    Four days of accumulating Aqua MODIS sea surface temperature swaths during the period of Hurricane Katrina, from August 27, 2005 through August 30, 2005.
Duration: 19.0 seconds
Available formats:
  1024x512 (25 fps) MPEG-1   6 MB
  1024x512   Frames
  320x160     PNG           95 KB
  160x80       PNG           19 KB
  80x40         PNG           5 KB
  1024x512 (25 fps) MPEG-4   6 MB
How to play our movies

This product is available through our Web Map Service.   Click here to learn more.


Legend for sea surface temperature measurements.
   Legend for sea surface temperature measurements.

Available formats:
  320 x 90           PNG 10 KB

Animation Number:3324
Animator:Horace Mitchell (SVS) (Lead)
Completed:2006-04-07
Scientists:Norman Kuring (NASA/GSFC)
 Gene Feldman (NASA/GSFC)
Instrument:Aqua/MODIS
Data set:Sea Surface Temperature
Data Collected:2005/08/26T23:17:35 - 2005/08/30T21:52:34
Keywords:
DLESE >> Physical oceanography
GCMD >> EARTH SCIENCE >> Oceans >> Ocean Temperature >> Sea Surface Temperature
GCMD >> EARTH SCIENCE >> Spectral/Engineering >> Platform Characteristics >> Orbital Characteristics
GCMD >> EARTH SCIENCE >> Spectral/Engineering >> Sensor Characteristics >> Viewing Geometry
View Animation in Google Earth Google Earth KML file is available here.
DEPC Metadata is available here.
 
 
Please give credit for this item to
NASA/Goddard Space Flight Center Scientific Visualization Studio


Back to Top

USA.gov logo - the U.S. Government's official Web portal. + Privacy Policy and Important Notices
+ Reproduction Guidelines
NASA NASA Official:
SVS Contact:
Curator: