|

NPA Research Gets Results – The Products!
"Research Excellence: Meeting Customer Expectations"
Models & Software | Germplasm | Informational Sites | Other
ARS has a long history of research outcomes of benefit to agricultural producers, industry and the American public. Below is just a sampling of some of the products generated by ARS research efforts in the Northern Plains Area, where our motto is "Research Excellence: Meeting Customer Expectations." Additional information on NPA research results can also be found through the "Publications" link at left which will take visitors to a chronological list of recent NPA scientific publications. Tip: There is a search feature on every page (at the top of the left-hand navigation bar) that can help you quickly locate articles on subjects of interest to you.
Additional information on NPA research outcomes can also be found on our NPA Research Gets Results! - An Overview page and through the individual lab and unit websites of each of our 14 NPA locations, linked at right.
Models and Software
AgroEcosystem | CPED | Crop Sequence Calculator | DECI | GPFARM | GPFARM Information System | Invasive Weed Calculator | KINEROS2 | NLEAP | Opus | Opus GUI | Phenology MMS | PROBIT | RZWQM | RZWQM2 | RootSim2D | SamplePoint | SGA | SGA Pro | SHOOTGRO | SMART | SPUR2 | WeedSite | WEPS | WISDEM
Note: Several of these models and software programs, as well as many others from other Areas in ARS, are available on the national ARS Software site. Some models and/or software may require registration to download. Privacy information is posted with those downloads.
AgroEcosystem Performance Assessment Tool
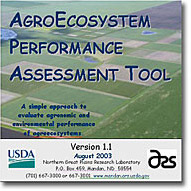 The AgroEcosystem Performance Assessment Tool is a computer program used to evaluate the agronomic and environmental performance of management practices in long-term agroecosystem experiments. The program employs a simple scoring method to quantify the performance of management practices using indicators grouped within agroecosystem functions. Management practices are evaluated on a relative basis using the method, thereby internalizing comparisons. Because of its specialized application to long-term experiments, the program is designed primarily for use by agricultural researchers. (Mandan, Lincoln) The AgroEcosystem Performance Assessment Tool is a computer program used to evaluate the agronomic and environmental performance of management practices in long-term agroecosystem experiments. The program employs a simple scoring method to quantify the performance of management practices using indicators grouped within agroecosystem functions. Management practices are evaluated on a relative basis using the method, thereby internalizing comparisons. Because of its specialized application to long-term experiments, the program is designed primarily for use by agricultural researchers. (Mandan, Lincoln)
Back to top
CPED
The Center Pivot Evaluation and Design (CPED) computer program models water distribution under a Center Pivot or a Linear Move sprinkler system. Water distribution is modeled using the sprinkler inventory, the pump characteristics, and terrain changes in the field. The output from CPED can be used to replace can tests when calculating system uniformity. It assumes no wind conditions. (WMR - Fort Collins)
Back to top
Crop Sequence Calculator
 Mandan, ND’s Crop Sequence Calculator helps maximize profitability while protecting and preserving the environment. The “Crop Sequence Calculator” is a user-friendly tool designed to help producers assess crop production in a diverse cropping system. It’s an interactive program for viewing crop sequencing information when designing diverse cropping systems and calculating returns. It has become an important tool for Northern Plains farmers. (Mandan) Mandan, ND’s Crop Sequence Calculator helps maximize profitability while protecting and preserving the environment. The “Crop Sequence Calculator” is a user-friendly tool designed to help producers assess crop production in a diverse cropping system. It’s an interactive program for viewing crop sequencing information when designing diverse cropping systems and calculating returns. It has become an important tool for Northern Plains farmers. (Mandan)
Back to top
DECI
The Decision Evaluator for the Cattle Industry (DECI) model represents decision support software (DSS) created for the beef industry. DECI is a personal computer program for managing cattle and provides ranchers with a tool to evaluate strategic decisions affecting productivity and profitability through multiple marketing endpoints for an individual herd of breeding females. The herd is defined as a group of females that are managed as a single unit through a production year. The software is composed of a friendly graphical user interface for information input required for parameterizing a deterministic simulation model and presentation of results. User input information describing animal genetic resources, feed resources, feed resource allocation and strategic management practices parameterize the herd level model. Predicted productivity is reported in either graphical of tabular format. Application of the DSS is initiated through establishment of a baseline herd that is accomplished by setting the model parameters to the current production practices for the herd. Once established, the effect of single strategic management decisions on future herd productivity and the enterprises financial position can be evaluated. At present, the definition of historical and future productivity and financial information are consistent with the guidelines of the Standardized Performance Analyses established by the National Cattlemen's Beef Association. Production information from simulations of various management scenarios can be output for applying alternative software packages. (Clay Center)
Back to top
GPFARM
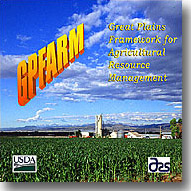 The Great Plains Framework for Agricultural Resource Management (GPFARM) is a Decision Support System for dryland grain producers in the northern Great Plains The Great Plains Framework for Agricultural Resource Management (GPFARM) is a Decision Support System for dryland grain producers in the northern Great Plains
GPFARM is a model computer application capable of simulating and analyzing 10-50 year farm/ranch production plans with respect to water, nutrient, and pest management along with their associated economic and environmental risks. It incorporates state of the art knowledge in agronomy, animal science, economics, weed science and risk management into a user-friendly, decision support tool. Producers, agricultural consultants, action agencies and scientists can utilize GPFARM to test alternative management strategies that may in turn lead to sustainable agriculture, a reduction in pollution, or maximum economic return. GPFARM Express contains default projects to allow users to quickly set up their operations. (ASRU - Fort Collins)
Products within GPFARM:
- A user-friendly, farm/ranch simulation model that produces output for various agricultural production systems and management options with respect to economics, environmental impact and sustainability.
- A detailed whole farm/ranch economic analysis package (PAL Budgeting Program).
- A web based, encyclopedic agricultural information system.
- A stand-alone weed management model (WISDEM).
- Tools to analyze weed pressure effects and N fertilizer requirements.
- Analysis tools for results including output data visualization, indices and the Multiple Criterion Decision Making model.
- Spatial data visualization tools.
NOTE: The Colorado Association of Wheat Growers currently provides GPFARM in its membership packet.
Back to top
GPFARM Information System
This system has been developed to provide users with a source of information to assist them in evaluating farm and ranch management options and in making decisions regarding the profitable use of the land they manage. The GPFARM Information System includes information regarding:
- Crops and crop management
- Range and pasture management
- Livestock production
- Soil, water, and nutrient management
- Pests and pest control
The intent of the Information System is to offer a wide range of materials to the user. The sources of information include agricultural databases, research and extension fact sheets, and other pertinent commercial, state, and federal sources. (ASRU - Fort Collins)
Back to top
Invasive Weed Impact Calculator
The Invasive Weed Impact Calculator helps managers determine cost-effectiveness of weed management practices. The calculator accepts location-specific weed abundance data from land managers and uses these data to estimate weed impacts on desired species and forage production. Numerous tools are available for invasive weed management (e.g. herbicides, seeding, prescribed grazing). The Invasive Weed Impact Calculator helps managers compare costs and benefits of applying these tools by enabling them to estimate the amount of desired species lost to weeds. (Miles City)
Back to top
KINEROS2
KINEROS2, or Kinematic simulation of catchment runoff and erosion processes, is an event-based hydrologic model, meaning that long periods of soil water redistribution, plant growth, and other inter-storm changes are not treated. A rainfall record describing the rainfall rate pattern is used to simulate the runoff over a catchment of rather arbitrary complexity. The catchment is described by an abstraction into a tree-like network sequence of surfaces and channels. Infiltration is described by a model which includes small-scale spatial variability, a crust layer, and treatment of redistribution during rain hiatus. Runoff is routed with an implicit finite difference solution of the kinematic wave equation. Erosion is simulated as a simple transport process operating with erosive detachment from splash and hydraulic sources, in equilibrium with settling based on particle fall velocity. The model allows pipe flow and pond elements as well as infiltrating surfaces, and includes a partially paved element to use in urban area simulation. (WMR - Fort Collins)
Back to top
NLEAP
 Nitrate Leaching and Economic Analysis Package (NLEAP) is a field-scale computer model developed to provide a rapid and efficient method of determining potential nitrate leaching associated with agricultural practices. The processes modeled include movement of water and nitrate, crop uptake, denitrification, ammonia volatilization, mineralization of soil organic matter, nitrification, and mineralization-immobilization associated with crop residue, manure, and other organic wastes. It uses basic information concerning on-farm management practices, soils, and climate to project N budgets and nitrate leaching indices. NLEAP calculates potential nitrate leaching below the root zone and to ground water supplies. NLEAP has three levels of analysis to determine leaching potential: an annual screening, a monthly screening, and an event-by-event analysis, which provides the best estimate of nitrate leaching. The event-based procedure is recommended for analysis of potential nitrate leaching to domestic water supplies. (ASRU - Fort Collins) Nitrate Leaching and Economic Analysis Package (NLEAP) is a field-scale computer model developed to provide a rapid and efficient method of determining potential nitrate leaching associated with agricultural practices. The processes modeled include movement of water and nitrate, crop uptake, denitrification, ammonia volatilization, mineralization of soil organic matter, nitrification, and mineralization-immobilization associated with crop residue, manure, and other organic wastes. It uses basic information concerning on-farm management practices, soils, and climate to project N budgets and nitrate leaching indices. NLEAP calculates potential nitrate leaching below the root zone and to ground water supplies. NLEAP has three levels of analysis to determine leaching potential: an annual screening, a monthly screening, and an event-by-event analysis, which provides the best estimate of nitrate leaching. The event-based procedure is recommended for analysis of potential nitrate leaching to domestic water supplies. (ASRU - Fort Collins)
Back to top
Opus
Opus is a model for simulating water-based transport processes in and on the surface soil. Opus simulates the vertical movement and transport of water in the rootzone soil profile, plus the surface water movement and transport of material during rainfall runoff on a small catchment. Simulated soil processes include unsaturated soil water flow, plant growth and transpiration, soil evaporation, soil water transport and decomposition of adsorbed chemicals, soil C, N and P cycling and residue decomposition, using the Century model (Parton et al., 1988). Surface water flow and soil erosion and transport are simulated during runoff events. Subsurface drains may be treated as well.
The changes in soil and plant cover due to agricultural management are simulated based on user input of the types of management actions (tillage, fertilization, spraying, etc.) and the schedule of such actions. Plants are grown after planting using a mechanistic model in which the plant responds to nitrogen, water, and temperature stresses. Chemicals applied are traced through the soil and are subject to adsorption kinetics as well as environmental degradation. Manure and fertilizers may also be applied. A rotation period of up to 5 years can be treated. The overall simulation period may be as long as is necessary for the purpose of the user, such as comparison of the effects of alternate management methods. (WMR - Fort Collins)
Back to top
Opus GUI
The purpose of the Opus GUI is to simplify and help the user to prepare the required parameter datafile needed to run the Opus simulation model. Using this interface, the user can create a new Opus datafile, read and edit an existing (complete and/or incomplete) datafile, or read and edit the Opus sample datafile from sites in Watkinsville, GA. Note that only the parameter datafile may be created using this version of the user interface. In designing this interface, care was taken to ensure consistency among screens. Efforts were directed toward interface simplicity, ease of use, and functionality. In addition to brief descriptive text material given directly on the screen, three levels of help are also available to further explain each parameter. (WMR - Fort Collins)
Back to top
PhenologyMMS
Understanding crop phenology is fundamental to crop management, where timing of management practices is increasingly based on stages of crop development. Simulating canopy development is also critical for crop growth models, whether to predict the appearance of sources and sinks, determining carbon assimilation and transpiration, partitioning carbohydrates and nutrients or determining critical life cycle events such as anthesis and maturity. PhenologyMMS is a simulation model that outlines and quantifies the developmental sequence of different crops under varying levels of water deficits, provides developmental information relevant to each crop, and is intended to be used either independently or inserted into existing crop growth models.
A Java-based interface is used for the standalone model that allows the user to interact with the underlying Fortran simulation model. The model requires daily maximum and minimum air temperature and precipitation (historical climate information for selected sites is provided), planting date and depth, and general soil moisture description at time of planting. The model calculates when each growth stage is reached by one of two methods: either growing degree-days (GDD) or number of leaves. Default values are provided for the GDD that must accumulate or the number of leaves that must be produced between each growth stage for both stressed and unstressed environments. Currently, nine common crops grown in the Great Plains are parameterized: winter and spring wheat, winter and spring barley, corn, sorghum, sunflower, proso millet, and hay millet. The model outputs the date each growth stage is reached by the specific crop and how many days each stage occurs after planting, emergence and vernalization, if applicable. It also displays the GDD values for the growth stages after planting, after emergence and after vernalization as well as the number of leaves produced at each growth stage. Final plant height is estimated. (ASRU - Fort Collins)
Back to top
PROBIT
Probit analysis is used by researchers for statistical analysis of data from bioassay studies, such as determining the effects of different doses of insecticides on insect mortality. PROBIT is a software program that is used to analyze bioassay data when multiple observations over time were made on the same groups of organisms at one dose of a stimulus, also called a serial time-mortality analysis. There are also accessory programs for transforming probit-transformed data back to proportion of test organisms responding to a stimulus, thus enabling graphing of observed and predicted data to assess goodness-of-fit of the probit line; a program for calculating relative potency of two lethal doses; and a program for determining whether slopes and intercepts from two probit equations are different. The programs are written in the Mathematica language, so the user must have the Mathematica software on their computer to run these programs. (Manhattan)
Back to top
RZWQM
 The Root Zone Water Quality Model (RZWQM) is a process based model that simulates major physical, chemical, and biological processes in an agricultural crop production system. RZWQM is a one-dimensional (vertical in the soil profile) process-based model that simulates the growth of the plant and the movement of water, nutrients and agro-chemicals over, within and below the crop root zone of a unit area of an agricultural cropping system under a range of common management practices. The model includes simulation of a tile drainage system. The primary use of RZWQM is for assessing the environmental impact of alternative agricultural management strategies on the subsurface environment. These alternatives may include: conservation plans on field-by-field basis; tillage and residue practices; crop rotations; planting date and density; and irrigation- , fertilizer- , and pesticide-scheduling (method of application, amounts and timing). The model predicts the effects of these management practices on the movement of nitrate and pesticides to runoff and deep percolation below the root zone. That is, the model predicts the potential for pollutant loadings to the groundwater thus allowing an assessment of nonpoint-source pollutant impacts on surface and ground water quality. (ASRU - Fort Collins) The Root Zone Water Quality Model (RZWQM) is a process based model that simulates major physical, chemical, and biological processes in an agricultural crop production system. RZWQM is a one-dimensional (vertical in the soil profile) process-based model that simulates the growth of the plant and the movement of water, nutrients and agro-chemicals over, within and below the crop root zone of a unit area of an agricultural cropping system under a range of common management practices. The model includes simulation of a tile drainage system. The primary use of RZWQM is for assessing the environmental impact of alternative agricultural management strategies on the subsurface environment. These alternatives may include: conservation plans on field-by-field basis; tillage and residue practices; crop rotations; planting date and density; and irrigation- , fertilizer- , and pesticide-scheduling (method of application, amounts and timing). The model predicts the effects of these management practices on the movement of nitrate and pesticides to runoff and deep percolation below the root zone. That is, the model predicts the potential for pollutant loadings to the groundwater thus allowing an assessment of nonpoint-source pollutant impacts on surface and ground water quality. (ASRU - Fort Collins)
Back to top
RZWQM2
RZWQM2 is an enhancement of the Root Zone Water Quality Model (RZWQM), created in response to users' requests. As a result, RZWQM2 is an advanced, but practical, model of root zone processes that influence soil and water quality, soil water and nutrient status, and crop production. It is unique in its major emphasis on simulating the effects of major agricultural management practices on physical-chemical processes and plant growth, and the movement of water, nutrients, and pesticides to runoff and through the crop-root zone to shallow groundwater. The model allows simulation and evaluation of a wide spectrum of management practices, such as no-tillage and residue cover vs. conventional tillage; rates, methods, and timings of application of water, fertilizers, manures, and various pesticides; and different crop rotations. The model contains the special features of tile drainage and rapid transport of surface-applied chemicals through soil macropores to deeper depths, groundwater and tile flow. The model requires daily weather data (maximum and minimum daily temperature, solar radiation, wind speed, relative humidity, and rainfall), soil texture, soil bulk density, soil hydraulic properties (if known), and recorded management practices. RZWQM2 is a one-dimensional model with a pseudo 2-dimensional drainage flow and water table fluctuation. Users have the options of using a generic plant growth model or the DSSAT4.0 plant models. (ASRU - Fort Collins)
NOTE: The Root Zone Water Quality Model 2 recently won both an ARS and national FLC tech transfer award. The model is used by the EPA to regulate new chemical registration. Chemical companies also use it when preparing their applications to EPA and have stated that RZWQM2 has saved them millions of dollars.
Back to top
RootSim2D
RootSim2D is a two-dimensional model of corn root growth developed and linked to a two-dimensional model for water, heat and solute transport in soils. The purpose of this model is to research how different management practices influence root growth and utilization of water and nitrogen from different parts of the root zone. This knowledge is then used to identify practices that help the most efficient use of water and nitrogen and minimize leaching below the root zone. The model may also be used by plant breeders to screen new varieties for their root growth. (ASRU - Fort Collins)
Back to top
SamplePoint
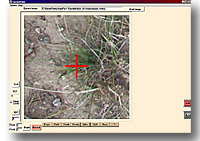 SamplePoint is a manual image-analysis program designed to facilitate vegetation cover measurements from nadir digital images of any scale. Operating essentially as a digital point frame, the software loads images, places classification points on the image, and stores classification data to a database as the user classes each point. Functional use is not limited to vegetation classification. Measuring percent occurrence of objects from digital images can save time and expense relative to conventional field measurements. However, the accuracy of image analysis had, until now, not reached the level of the best conventional field measurements. Additionally, most image-analysis software programs require advanced user training to successfully analyze images. Here we present a new software program, ‘SamplePoint,’ that provides the user a single-pixel sample point and the ability to view and identify the pixel context. We found SamplePoint to allow accuracy comparable with the most accurate field-methods for ground-cover measurements. Expert use of the program requires minimal training and its ease of use allows rapid measurements from image data. We recommend SamplePoint for calibrating the threshold-detection level of image-analysis software or for making direct measurements of percent occurrence from digital images. (RRRU - Cheyenne, Fort Collins) SamplePoint is a manual image-analysis program designed to facilitate vegetation cover measurements from nadir digital images of any scale. Operating essentially as a digital point frame, the software loads images, places classification points on the image, and stores classification data to a database as the user classes each point. Functional use is not limited to vegetation classification. Measuring percent occurrence of objects from digital images can save time and expense relative to conventional field measurements. However, the accuracy of image analysis had, until now, not reached the level of the best conventional field measurements. Additionally, most image-analysis software programs require advanced user training to successfully analyze images. Here we present a new software program, ‘SamplePoint,’ that provides the user a single-pixel sample point and the ability to view and identify the pixel context. We found SamplePoint to allow accuracy comparable with the most accurate field-methods for ground-cover measurements. Expert use of the program requires minimal training and its ease of use allows rapid measurements from image data. We recommend SamplePoint for calibrating the threshold-detection level of image-analysis software or for making direct measurements of percent occurrence from digital images. (RRRU - Cheyenne, Fort Collins)
Back to top
SGA
 Stored Grain Advisor (SGA) is a software program that helps farmers manage insect pests of farm-stored wheat. SGA predicts the likelihood of insect infestation, and recommends preventative and remedial action. It also provides advice on how to sample and identify insect pests of stored wheat. Farmers can use the computer models of insect population growth to predict future insect populations in the grain bin, as well as the breakdown of insecticides, the effects of fumigation, and cooling the wheat with aeration. SGA can also be used as an educational tool by researchers and extension to teach stored grain concepts. (Manhattan) Stored Grain Advisor (SGA) is a software program that helps farmers manage insect pests of farm-stored wheat. SGA predicts the likelihood of insect infestation, and recommends preventative and remedial action. It also provides advice on how to sample and identify insect pests of stored wheat. Farmers can use the computer models of insect population growth to predict future insect populations in the grain bin, as well as the breakdown of insecticides, the effects of fumigation, and cooling the wheat with aeration. SGA can also be used as an educational tool by researchers and extension to teach stored grain concepts. (Manhattan)
Back to top
SGA Pro
 Stored Grain Advisor (SGA) Pro is a software program that provides advice on managing insects in commercial grain elevators. After the bins are sampled for insects with a vacuum probe, SGA Pro analyzes the data, grain temperatures and moistures, and determines which bins need to be fumigated. The software also predicts future insect problems based on current grain temperature. The software is targeted for commercial elevator managers. (Manhattan) Stored Grain Advisor (SGA) Pro is a software program that provides advice on managing insects in commercial grain elevators. After the bins are sampled for insects with a vacuum probe, SGA Pro analyzes the data, grain temperatures and moistures, and determines which bins need to be fumigated. The software also predicts future insect problems based on current grain temperature. The software is targeted for commercial elevator managers. (Manhattan)
Back to top
SHOOTGRO
SHOOTGRO emphasizes the development and growth of the shoot apex of small-grain cereals such as winter and spring wheat (Triticum aestivum L.) and spring barley (Hordeum vulgare L.). To better incorporate the variability typical in the field, up to six cohorts, or age classes, of plants are followed using a daily time step. Within each plant of a cohort, the appearance of each tiller is simulated, and for each culm (main stem and tillers), the phenological growth stage and appearance, growth, and senescence/abortion of each leaf, internode, spikelet, floret, kernel, rachis, and chaff is simulated. The model has been evaluated under conditions from the Great Plains, Pacific Northwest, South Africa, Italy, and England. Applications of the model:
- Assist NRCS field offices to determine if producers are in compliance with erosion control requirements for participation in federal programs. Specifically, the amount of green biomass production of winter wheat was simulated for different planting dates, sowing rates, soil water and N at planting, and weather scenarios.
- Run SHOOTGRO in real-time to predict the specific growth stage of winter wheat so that the correct herbicide/insecticide could be selected based on the label. A related application was to convert among different growth stage scales, since these can differ on herbicide/ insecticide growth stage scales used.
- Different optimal N fertilizer and irrigation levels were calculated for selected sites in the U.S.
- Different global climate change scenarios were evaluated for selected sites in the U.S.
- SHOOTGRO has been used to assist in directing field research programs, particularly in identifying knowledge gaps in our quantification of developmental processes. (ASRU - Fort Collins)
Back to top
SMART
Screening and Multivariate Analysis for Risk and Tradeoffs (SMART) is both a web-based and MS Excel spreadsheet tool that uses the Certainty Equivalent (CE) concept for ranking risky alternatives. CE is a utility-based measure defined as the expected value of an input variable minus the risk premium (the amount of monetary value a decision maker is willing to pay in order to avoid risk). In other words, the CE of a risky strategy is the amount of money at which the decision maker is indifferent between the certain dollar value and the risky strategy. Strategies with higher CEs are preferred to those with lower CEs. The SMART procedure calculates the CE for the decision maker using the Stochastic Efficiency with Respect to a Function (SERF) method. SMART also functions as a risk visualization tool for graphically displaying the CE at various levels of decision maker attitude towards risk (e.g., risk neutral, moderately risk averse, or extremely risk averse). SMART then uses the CE calculations at various risk levels to conduct and analyze complex tradeoffs between economic (e.g., gross margin) and environmental (e.g., nitrate leaching) variables or indicators. (ASRU - Fort Collins)
Back to top
SPUR2
SPUR2, Simulating Production and Utilization of Rangelands, ver. 2, is a general grassland ecosystem simulation model designed to determine beef cattle performance and production by simultaneously simulating production of up to 15 plant species on 36 heterogeneous grassland sites. SPUR2 simulates grassland hydrology, nitrogen cycling, and soil organic matter on grazed ecosystems as well as rangeland production under different climatic regimes, environmental conditions, and management alternatives. (ASRU - Fort Collins)
Back to top
WeedSite
WeedSite software was developed for predicting the benefits of postemergence site-specific weed management in irrigated corn and how the benefits vary with the weed population and the approach for variable herbicide application. Georeferenced weed maps and GIS software are not needed. Net gain from site-specific weed management, area of the field not treated, herbicide use and cost, yield loss from weed competition, and weeds left in the field are all calculated from hand drawn weed maps. Results can be mapped. WeedSite is useful for educating growers, agricultural consultants and students about the potential benefits of postemergence site-specific weed management because predictions are consistent with what is known about the variation in the benefits of site-specific weed management. Also, users specify the distribution of weeds in a field, so the results may be more relevant to them than information from research studies. The installation package includes a user’s manual. (WMR - Fort Collins)
Back to top
WEPS
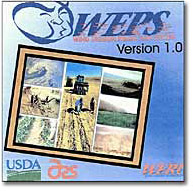 The Wind Erosion Prediction System (WEPS) was initiated as a multi-disciplinary research effort, led by ARS scientists in response to customer requests for improved wind erosion technology. It is intended to replace the predominantly empirical 40-year-old Wind Erosion Equation (WEQ). WEPS incorporates improved technology for computing soil loss by wind from agricultural fields as well as providing new capabilities such as calculating suspension loss, estimating PM-10 emissions and specifying the direction soil leaves the field. In partnership with NRCS, WEPS was developed to be an easy to use process-based prediction tool for those who plan soil conservation systems, conduct environmental planning, evaluate the effects of alternative management practices and assess off-site impacts caused by wind erosion. For more information on WEPS, click here. (Manhattan) The Wind Erosion Prediction System (WEPS) was initiated as a multi-disciplinary research effort, led by ARS scientists in response to customer requests for improved wind erosion technology. It is intended to replace the predominantly empirical 40-year-old Wind Erosion Equation (WEQ). WEPS incorporates improved technology for computing soil loss by wind from agricultural fields as well as providing new capabilities such as calculating suspension loss, estimating PM-10 emissions and specifying the direction soil leaves the field. In partnership with NRCS, WEPS was developed to be an easy to use process-based prediction tool for those who plan soil conservation systems, conduct environmental planning, evaluate the effects of alternative management practices and assess off-site impacts caused by wind erosion. For more information on WEPS, click here. (Manhattan)
Back to top
WISDEM
WISDEM simulates population dynamics of multi-species weed populations in response to crop rotation, tillage system, and specific weed management tactics as well as the resulting crop yield reduction from weed competition. The model uses an innovative structure for modeling weed population dynamics that requires only a small number of parameters and these can be readily derived from literature sources and regional surveys of weed experts. The structure is based on the general theory of density dependence of plant productivity and the extensive use of rectangular hyperbolic equations for describing crop yield as a function of weed density. Only two density-independent parameters are required for each species to represent differences in seed bank mortality, seedling emergence and maximum seed production. One equation is used to model crop yield loss and density-dependent weed seed production as a function of crop and weed density, relative time of weed and crop emergence and differences among species in competitive ability. WISDEM has been parameterized for 4 crops and 15 weeds of the Great Plains. A preliminary, limited evaluation provides evidence that predictions of yield loss from single species of weeds and the short term trajectories of changes in weed populations are biologically reasonable. We think the accuracy is sufficient for the goal of modeling general trends in population density accurately enough to highlight potential weed problems and solutions when comparing alternative crop management options for a field. (WMR - Fort Collins)
Back to top
Germplasm Preservation and Releases
National Center for Genetic Resources Preservation

The Northern Plains Area, Fort Collins, CO location is also home to the National Center for Genetic Resources Preservation (NCGRP), a USDA, ARS facility that is one of the world’s largest genebanks, housing genetic resources of plants and animals with current or future importance to agriculture. Genetic diversity of species is maintained through multiple accessions of germplasm collected from around the world from wild populations, landraces and improved breeding stock. The three research units at the NCGRP are dedicated to the maintenance of genetic resources and researching new ways to conserve genetic resources. Future expansion will allow NCGRP to preserve genetic resources of beneficial insects and microbes. NCGRP houses the base collection for plant genetic resources for USDA’s National Plant Germplasm System (NPGS), a network of cooperating institutions, agencies and research units in the Federal, State and private sectors. The plants are grown, evaluated and regenerated at regional Plant Introduction Stations and repositories around the country. Germplasm from this facility and others across the nation are included in the USDA, ARS’s Germplasm Resources Information Network (GRIN) web server, which provides germplasm information about plants, animals, microbes and invertebrates. For imformation on the collections, click here.
Back to top
Germplasm Releases:
Included below are links to various NPA locations providing information on germplasms, cultivars and related products on their websites. Research labs in Fargo, ND have also developed significant numbers of germplasm releases. Please see the Fargo website for additional information.
Fort Collins, CO
Sugar Beet Research Unit - Germplasm releases for growers, producers and beet sugar processors
Logan, UT
Forage & Range Research Lab - Germplasm and Cultivar Releases
Mandan, ND
Manifest Intermediate Wheatgrass – Germplasm Release (PDF)
Manhattan, KS
Plant Science & Entomology Research Unit – Germplasms links to wheat germplasm lines for wheat breeders, genotyping data (multiple traits) for breeders, and phenotyping data (Hessian fly, stripe rust, Karnal bunt) for breeders.
Back to top
Informational Sites
Lincoln, NE
Hard Winter Wheat Regional Nurseries
The information on this site is used by wheat breeders to decide whether experimental breeding lines should be released as cultivars, and by seedsmen and producers when making decisions as to wheat varieties to sell or plant. ARS has coordinated this program from Lincoln since 1932.
Back to top
Logan, UT
Poisonous Plants by Toxic Syndrome
The list includes links for more details on each plant and its toxic effects.
ID a Bumblebee
Handy chart to help identify the bumblebees of Northern Utah, with a wallet size option that can be downloaded from the Internet as a pdf.
Back to top
Manhattan, KS
Insect Images Database
Searchable database of stored-product insect pictures from the NPA’s Biological Research Unit at Manhattan.
Back to top
Back to top
Sidney, MT
Grasshoppers: Their Biology, Identification and Management
This website provides one of the most comprehensive sources of information on the biology, ecology, identification and management of grasshoppers and Mormon crickets in North America. It also contains information on non-target effects, current survey information, and decision support software.
TEAM Leafy Spurge (1998-2002)
Comprehenisve website on managing the noxious weed leafy spurge. It includes hundreds of articles and other information on leafy spurge and its management, along with pictures and other aids. A number of how-to-handbooks, informational CDs and a video on leafy spurge and its management are also available through this site.
Hoary Cress Consortium
Informational website on the noxious weed hoary cress, also known as whitetop. The site focuses on biological control of the weed and includes several research reports, along with a photo gallery.
Back to top
Other Products and Services
Grand Forks, ND
Nutrition Study Signups
Are you interested in participating in a scientific study regarding nutrition and eating habits? The Grand Forks Nutrition Lab provides information and sign-up sheets for ongoing studies by its researchers.
Clay Center, NE
Livestock Sale Information
Livestock (cattle and sheep) no longer needed for research are offered for sale. Information on those sales is provided here.
Sidney, MT
“E-rase Your E-waste”
This website provides templates and tips on setting up and hosting a community electronic waste recycling event.
Back to top
|