USDA Forest Service Celebrating Wildflowers
|
|
|
Plant Hardiness Zones
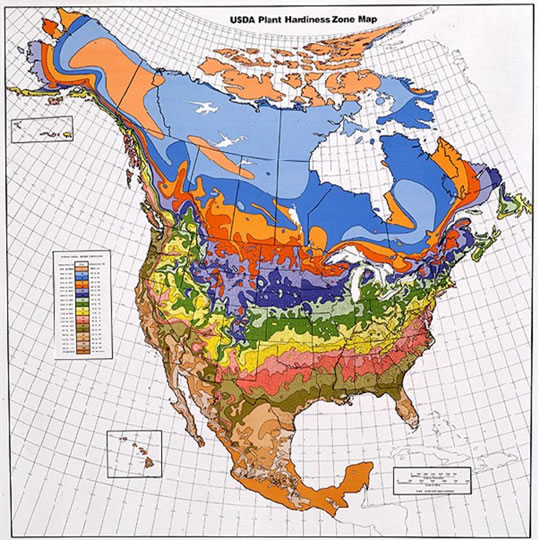
IntroductionThe following map was produced in 1990 by the US Department of Agriculture (USDA). This version shows in detail the lowest temperatures that can be expected each year in the United States, Canada, and Mexico. These temperatures are referred to as "average annual minimum temperatures" and are based on the lowest temperatures recorded for each of the years 1974 to 1986 in the United States and Canada and 1971 to 1984 in Mexico. The map shows 10 different zones, each of which represents an area of winter hardiness for the plants of agriculture and our natural landscape. It also introduces zone 11 to represent areas that have average annual minimum temperatures above 40 F (4.4 C) and that are therefore essentially frost free.
This information is provided by the U.S. National Arboretum, Agricultural Research Service, U.S. Department of Agriculture, Washington, DC 20002. Visit their site for a detailed, interactive version of this map. For an interactive map, Visit the National Arboretum Website. How to Use the MapZones 2-10 in the map have been subdivided into light- and dark-colored sections (a and b) that represent 5 F (2.8 C) differences within the 10 F (5.6 C) zone.
Zone 11 represents any area where the average annual minimum temperature is above 40 F (4.4 C). The map shows 20 latitude and longitude lines. Areas above an arbitrary elevation are traditionally considered unsuitable for plant cropping and do not bear appropriate zone designations. There are also island zones that, because of elevation differences, are warmer or cooler than the surrounding areas and are given a different zone designation. Note that many large urban areas carry a warmer zone designation than the surrounding countryside. The map-contains as much detail as possible, considering the vast amount of data on which it is based and its size.
Indicator Plant ExamplesTo examine the native species and their appropriate hardiness zone, the USDA National Arboretum has provided examples of plants by zones and cold hardiness ratings for woody plants. Explore the examples at the links below or visit the National Arboretum site to learn more.
In using the map to select a suitable environment for a landscape plant, today's gardeners should keep in mind the following:Stress Factors: The USDA became aware of additional stresses to plants during the 1970's. Acid rain, gaseous and particulate pollution, security lighting, and toxic wastes, among many other stress factors, have significantly increased the potential for unsatisfactory performance of landscape plants. We need to document the tolerances of plants to these factors. New Plant Management Systems: New techniques of planting, transplanting, watering, fertilizing, and providing pest control measures have done much to increase the vigor of landscape plants.But used unwisely, these same measures can reduce plant hardiness. Artificial Environments: As humans, we have pushed the use of plants into totally artificial environments such as expressways, malls, elevated decks, and buildings where plant roots are totally removed from the ground and its warming influence. The assortment of plants that can adapt to such environments is proving to be very restricted. Hardiness ratings alone are inadequate to guide landscapers in selecting the most successful plants. |
|||||||||||||||||||||||||||||||||||||||||||||||||||||||||||||||||||||||||||||||||||||
|
U.S. Forest Service
|
|||||||||||||||||||||||||||||||||||||||||||||||||||||||||||||||||||||||||||||||||||||
| NOTE: PDF format links require the Adobe Acrobat Reader to view. | |||||||||||||||||||||||||||||||||||||||||||||||||||||||||||||||||||||||||||||||||||||
| top | Disclaimers | FOIA | Privacy Policy | Quality of Information | Photo Credits & Use |

Location: http://www.fs.fed.us/wildflowers/nativegardening/hardinesszones.shtml
Last modified: Tuesday, 24-Jun-2008 21:54:50 EDT