|
||||||
|
|
||||||
Cryospheric Climate Indicators
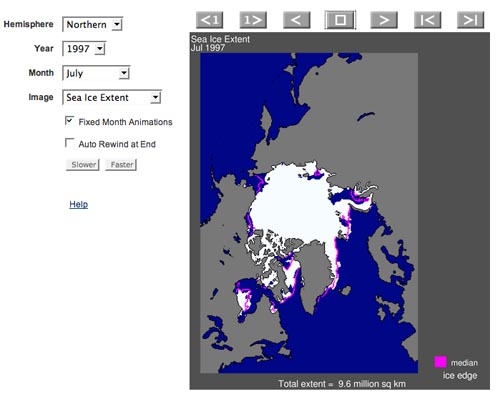
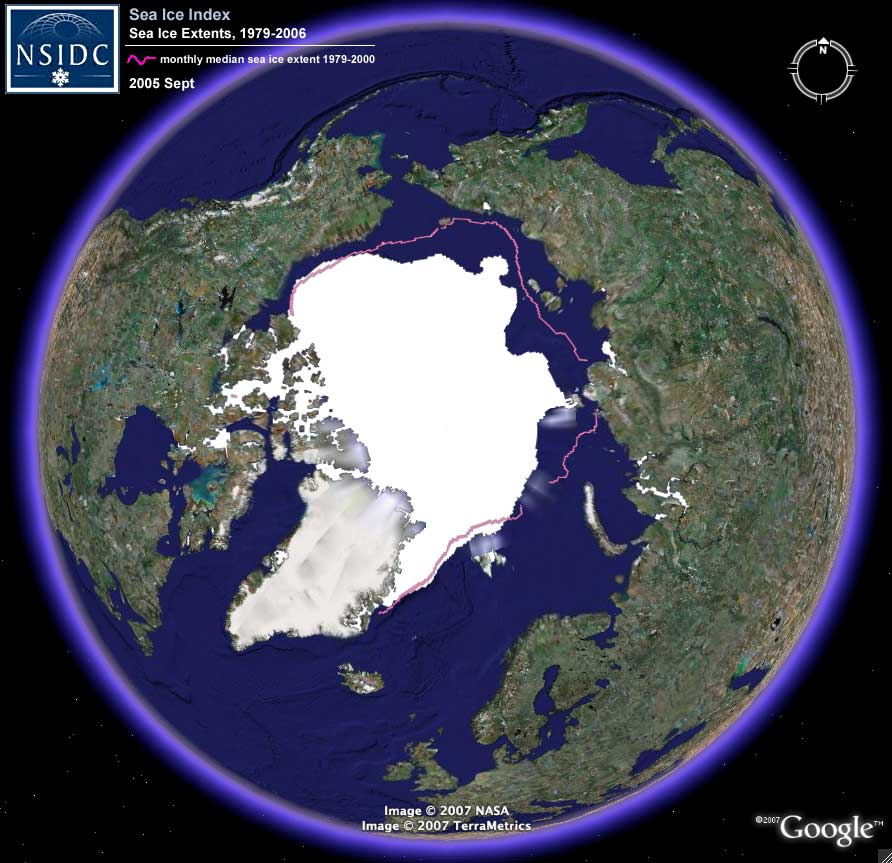
Sea Ice Index: Last month's sea ice conditions/Most recent daily sea ice conditions"A linear increase in heat in the Arctic Ocean will
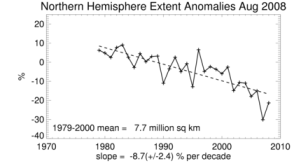
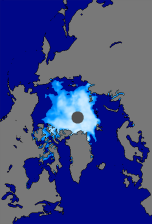
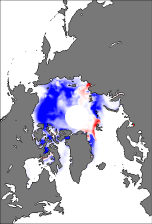
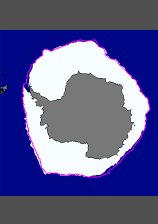
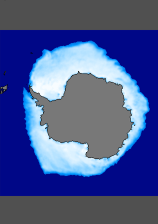
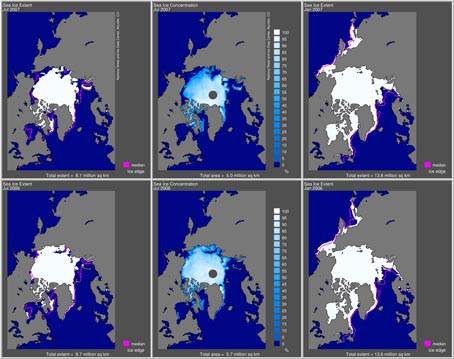
result in a non-linear, and accelerating, loss of sea ice." These images depict average sea ice conditions for last month. Graphs and images also provide snapshots of trends and anomalies, comparing last month's sea ice conditions with the mean for the month. Ice extent is derived from satellite passive microwave data. In the Northern Hemisphere, sea ice typically reaches its annual minimum extent in September, and its maximum extent in February or (usually) March. Daily images are also available. Monthly averages are considered more accurate indicators of overall trends. Please read Image Derivation and Interpretation Resources to understand the uses and limitations of these figures.
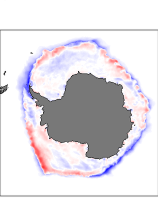
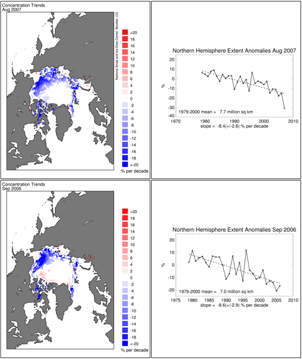
All anomalies and trends are calculated related to the monthly average, with a reference period of 1979-2000. Click an image thumbnail for a higher-resolution image and legend.
View Images, 1979 to PresentQuickly compare conditions in different months and years by displaying multiple images in tabular form, or animate images as a time series:
Sea Ice Index ReferencesMeier, W., J. Stroeve, F. Fetterer, K. Knowles. 2005. Reductions in arctic sea ice cover no longer limited to summer. Eos: Transactions of the American Geophysical Society 86, 326. Fetterer, F., and K. Knowles. 2004. Sea ice index monitors polar ice extent. Eos: Transactions of the American Geophysical Society 85, 163. User ServicesNSIDC strongly encourages you to register as a user of this data product. As a registered user, you will be notified of updates and corrections. When registering, please include the title of this data set, Sea Ice Index. AcknowledgementsFlorerence Fetterer, Kenneth Knowles, and NSIDC staff developed the Sea Ice Index with financial support from NOAA NESDIS and in cooperation with NOAA NGDC. This site is maintained with assistance from the NSIDC NASA DAAC. Citations and CreditsYou may download and use any images from the Sea Ice Index. Please credit NSIDC. Please use this citation when referencing the Sea Ice Index: Fetterer, F., K. Knowles, W. Meier, and M. Savoie. 2002, updated 2008. Sea Ice Index. Boulder, Colorado USA: National Snow and Ice Data Center. Digital media. |
|
||||||||||||||||||||||||||||||||||||||||||||
|
Supporting Cryospheric Research Since 1976 |
|