NWS PUEBLO Severe Weather Climatology Page
A "Severe Convective Weather Event" is defined as:
Hail = 3/4 of an inch in diameter or LARGER, and/or;
Wind Damage or Wind Speeds of 50 knots (58 mph) or STRONGER, and/or;
a Tornado.
Please note the following:
The size of the hailstone determines if the hail is considered "severe" or not. The depth of the hail on the ground does not determine if the hail is severe or not.
Example: You can have 4 inches of pea size (1/4") hail covering the ground, however this is not considered severe hail. On the other hand, you can have 1 hailstone that measures 4 inches in diameter, and this is considered severe.
Lightning is not considered "severe weather". If you wish to find out more about lightning in Colorado, please visit the NWS Pueblo Colorado Lightning Resource Page.
Severe Weather Program Leader
NWS Pueblo
_______________________________________________________________

The map above shows the counties in the NWS Pueblo County Warning Area (CWA). Severe weather statistics in this document are only for the counties shown in the above image. The counties above define southeast and south central Colorado.
Pie chart showing the distribution of the 3 types of severe weather events within NWS Pueblo CWA.

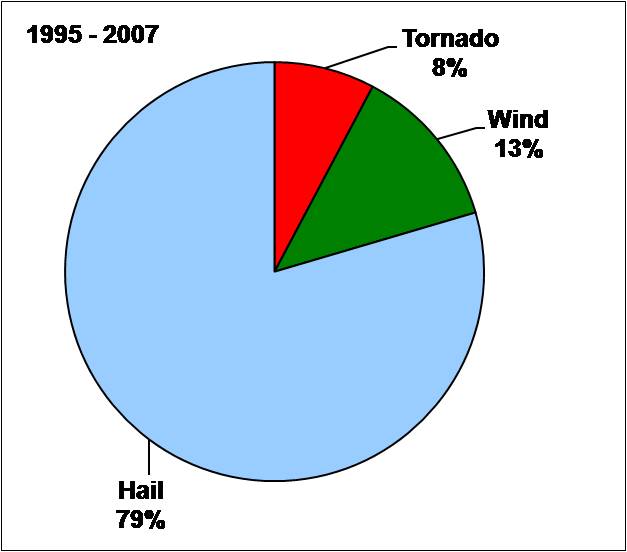
Pie chart showing the distribution (in percent) of the 3 types of severe weather within NWS Pueblo CWA.

Map of NWS Pueblo county warning area showing distribution of the 3 types of severe weather (hail, tornado and wind) in each county.
Map of NWS Pueblo county warning area showing severe hail size distribution for each county in southeast and south central Colorado.

Bar chart showing distribution of severe hail sizes across the NWS Pueblo CWA

Map of NWS Pueblo county warning area showing tornado distribution for each county in southeast and south central Colorado.
Bar chart showing distribution of tornadoes by EF Scale across the NWS Pueblo CWA.


Bar chart showing tornadoes by hour (mountain standard time) across the NWS Pueblo CWA

Bar chart showing tornadoes by month across the NWS Pueblo CWA.

Bar chart showing tornadoes by year across the NWS Pueblo CWA.

Bar graph showing tornado events per calendar day for the NWS Pueblo CWA from 1995 to 2006. As an example, there have been 52 days in which only one tornado report was received for that day; there have been 14 days in which 2 tornado reports have been received for that day, etc.

Map of NWS Pueblo county warning area showing severe convective wind distribution for each county in southeast and south central Colorado.

Bar chart showing distribution of severe wind reports across NWS Pueblo CWA.

Bar graph above shows the amount of all types of severe weather (hail, wind, tornadoes) for each hour (mst) across southeast and south central Colorado. As an example, there have been 351 severe weather reports between 4 and 5 pm mst across the NWS Pueblo CWA.

Bar graph above shows the number of all severe weather events for each day between 01 March and 31 October for the last 12 years (1995 - 2007). Click on the image for a larger view. No severe weather has been reported between the dates of November 1 and February 28.

Bar graph showing the amount of all types of severe weather events per calendar day from 1995 to 2007. As an example, there have been 162 days in which only one severe weather report was received for that day; there have been 125 days in which 2 severe weather reports have been received for that day, etc.
Based on data since 1995, the average date which severe weather begins in the NWS Pueblo CWA is 17 April. The average ending date is 27 September.
The earliest date severe weather began was 07 March 2000; the latest beginning date was 21 May 2006.
The earliest date severe weather ended was 5 September 2003; the lastest ending date was 29 October 2005.
In the average year, 154 severe weather weather events are recorded in the NWS Pueblo CWA. One hundred and twenty one (121) events are Hail, 13 are Tornadoes and 20 are Wind.
file=676pg2