Publications and Information Products

May 2008
Sleep Duration as a Correlate of Smoking, Alcohol Use, Leisure-Time Physical Inactivity, and Obesity Among Adults: United States, 2004-2006
by Charlotte A. Schoenborn, M.P.H., and Patricia F. Adams, Division of Health Interview Statistics
Page Content
Background
Prevalence of sleep
Sleep and smoking
Sleep and alcohol use
Sleep and physical inactivity
Sleep and obesity
Conclusions
About the data
References
Figures
Tables
PDF version 186 KB
Background
The importance of sleep in maintaining good health and quality of life is well recognized. Despite evidence of the health implications of insufficient sleep, a large number of Americans do not routinely get optimal hours of sleep (1). It is estimated that 70 million Americans are affected by chronic sleep loss or sleep disorders (1). National surveillance of adult sleep practices was first undertaken in the National Health Interview Survey (NHIS) in 1977 in response to the public health community's increased focus on healthy behaviors for promoting health and preventing disease (2).
This report provides a national perspective on the association between sleep and selected health risk behaviors using data from the 2004-2006 NHIS. Prevalence of cigarette smoking, alcohol use, leisure-time physical inactivity, and obesity are examined by usual sleep duration among a nationally representative sample of U.S. adults, stratified by sex, age, and race/ethnicity. The goal is to identify variations in prevalence of these health risk behaviors by usual sleep duration and to identify subgroups for which these associations may be particularly noteworthy. Direction of causality cannot be determined with cross-sectional survey data. However, identifying health risk behaviors among adults with varying sleep durations can provide useful information on possible clustering of behaviors that are known to be associated with unfavorable health outcomes.
Prevalence of sleep
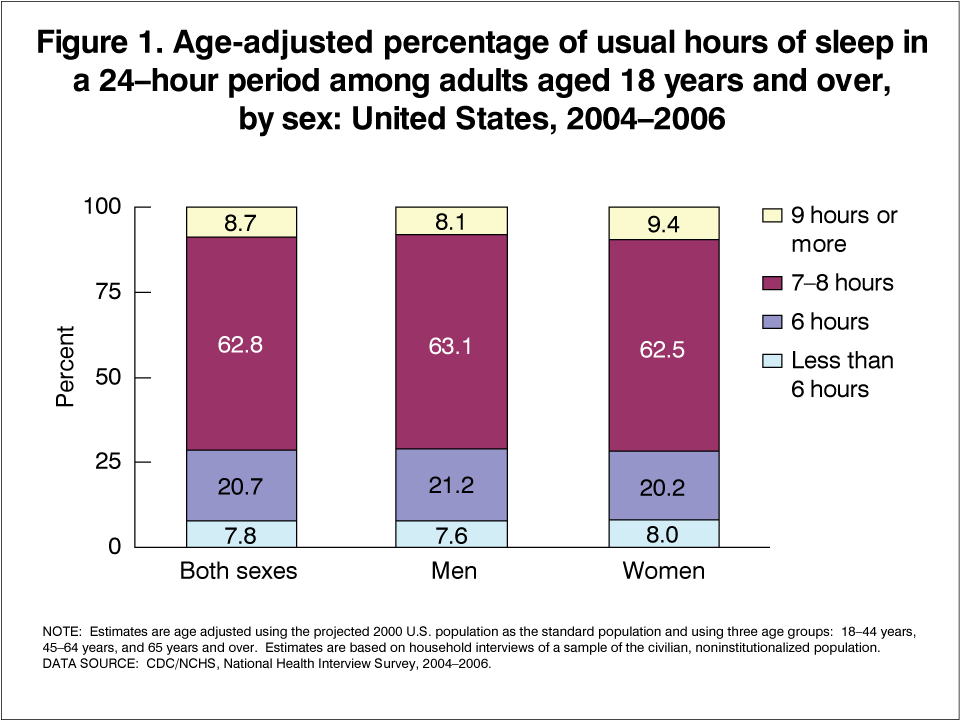
During the period 2004-2006, about 6 in 10 U.S. adults (63%) usually slept 7 to 8 hours in a 24-hour period (Figure 1). About 1 in 10 adults (8%) slept less than 6 hours, 2 in 10 slept 6 hours (21%), and about 1 in 10 (9%) slept 9 or more hours. Rates of cigarette smoking, alcohol use, leisure-time physical activity, and obesity varied by usual hours of sleep across most population subgroups studied (Tables 1-4). Sample size is limited for some subgroups. Estimates should be interpreted in conjunction with reported standard errors.
Sleep and smoking
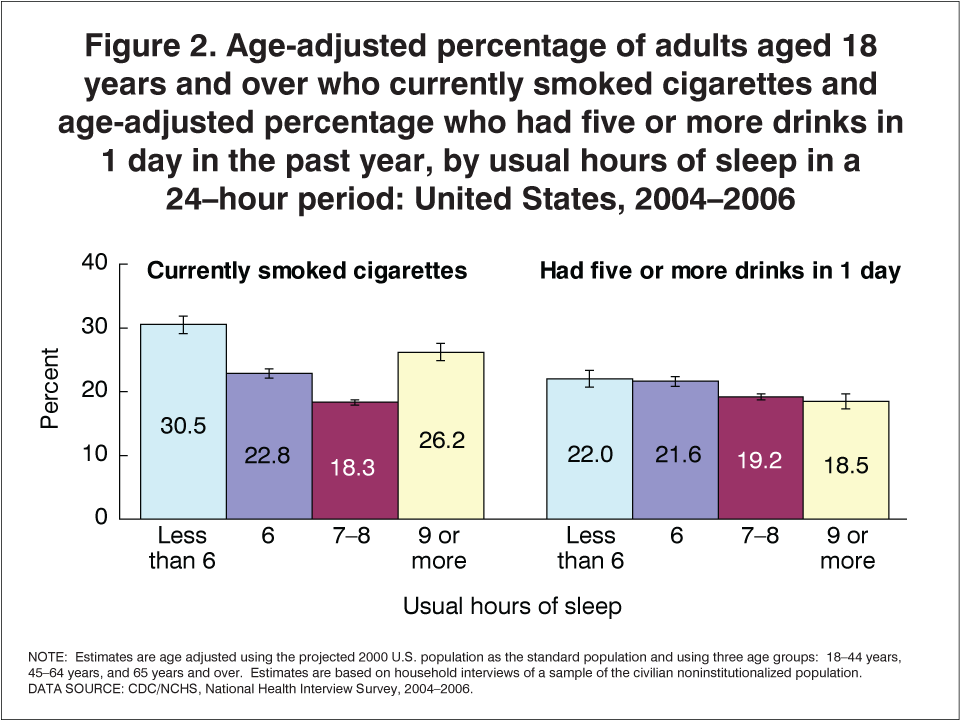
Overall, in 2004-2006, about 21% of U.S. adults were current cigarette smokers. Rates varied according to usual hours of sleep, and were lowest among adults who slept 7 to 8 hours (18%) and higher among adults who slept less than 6 hours (31%) or 9 hours or more (26%) (Figure 2). For both men and women, smoking prevalence was substantially higher among those who slept less than 6 hours than among men and women who slept 7 to 8 hours. Of the age groups studied, the association between hours of sleep and cigarette smoking was most notable for younger adults. Adults aged 18-44 years who slept less than 6 hours were more likely to be current smokers (38%) than adults in the same age group who slept 7 to 8 hours (21%). Variations by race and ethnicity were also found. Non-Hispanic white adults who slept less than 6 hours were more likely to be current smokers (34%) than non-Hispanic white adults who slept 7 to 8 hours (20%). Results for Hispanic adults also revealed higher smoking prevalence among those who slept less than 6 hours (19%) compared with those who slept 7 to 8 hours (13%) but the difference was smaller than for non-Hispanic white adults.
Sleep and alcohol use
Alcohol use also varied by usual hours of sleep, although to a lesser extent than observed for cigarette smoking. Overall, about one in five adults (20%) had had five or more drinks in 1 day in the past year. Prevalence of this behavior was slightly higher among adults who slept 6 hours or less (22%) than among adults who slept 7 to 8 hours (19%) or 9 hours or more (19%) (Figure 2). The association between having five or more drinks in 1 day and hours of sleep was most notable for men and for younger adults. Men who slept less than 6 hours were more likely to have had five or more drinks in 1 day (31%) than men who slept 7 to 8 hours (27%). Similarly, adults aged 18-44 years who slept less than 6 hours were more likely to have had five or more drinks in 1 day (33%) than adults in the same age group who slept 7 to 8 hours (26%) or 9 hours or more (26%). Sleep was unrelated to having five or more drinks in 1 day among adults aged 45 years and over for whom prevalence of consumption of this amount of alcohol was considerably lower.
Sleep and physical inactivity
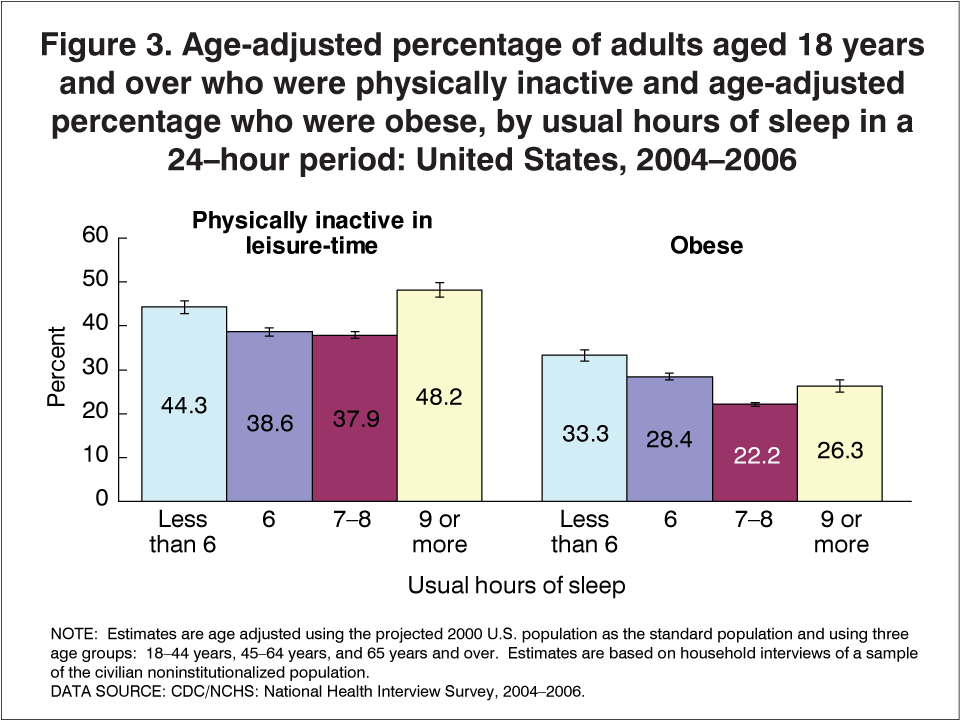
Overall, about 4 in 10 adults were physically inactive in their leisure time. Rates of leisure-time physical inactivity were lowest among adults who slept 6 hours (39%) or 7 to 8 hours (38%) (Figure 3). For both men and women and across all age groups studied, adults who slept less than 6 hours and those who slept 9 hours or more had higher rates of physical inactivity than adults who slept 7 to 8 hours. The same pattern was observed among non-Hispanic white adults. Rates of leisure-time physical inactivity were higher among non-Hispanic white adults who slept less than 6 hours (42%) or 9 hours or more (45%) compared with non-Hispanic white adults who slept 7-8 hours (33%). Non-Hispanic black adults who usually slept 9 hours or more (58%) had the highest rates of leisure-time physical inactivity and rates were lower among non-Hispanic black adults who slept 7 to 8 hours (52%), 6 hours (46%), or less than 6 hours (49%).
Sleep and obesity
Overall, about one in four adults were obese (25%), based on self-reported height and weight. Adults who slept less than 6 hours had the highest rate of obesity (33%) and adults who slept 7 to 8 hours had the lowest (22%) (Figure 3). This pattern was found for both men and women and across all age groups and most race/ethnicity groups studied. The association between sleep and obesity was less striking among adults aged 65 years and over than among younger adults.
Conclusions
The findings in this report, based on a survey of a representative sample of U.S. adults, offer a national perspective on the association between sleep practices and other health-related behaviors in the U.S. adult population. The findings presented here suggest that U.S. adults who usually slept less than 6 hours were more likely than adults who slept 7 to 8 hours to engage in certain health risk behaviors (i.e., cigarette smoking, having five or more drinks in a day, engaging in no leisure-time physical activity, and being obese). In many cases, adults who usually slept 9 hours or more were also at increased risk of engaging in these unhealthy behaviors. The associations between sleep and other behaviors are complex, and the directions of causality cannot be determined with the cross-sectional data used in this analysis. Additional analyses are needed to identify the causal directions of these relationships, as well as to identify factors, such as poverty or educational attainment, that may influence sleep and its associated factors. Despite these limitations, the findings presented here provide important information about the potential relevance of discussing health risk behaviors such as smoking, alcohol use, physical inactivity, and obesity with patients who seek medical advice for sleep concerns.
About the data
When the NHIS first asked a question about sleep in 1977, sleep had not yet emerged as a major public health issue. In the early 1980s the U.S. Department of Health and Human Services initiated a process of setting national health promotion and disease prevention objectives for the coming decade (3). Sleep was not included among the first two sets of national health objectives - those for 1990 or 2000 (3,4). It was not until the third generation of objectives (Healthy People 2010), currently guiding public policy for health promotion and disease prevention, that objectives related to sleep were included. Even then, objectives involving sleep were limited to a subset of goals within the focus area of respiratory diseases (Healthy People 2010 Focus Area number 24), targeting reductions in sleep apnea and sleepiness associated with motor vehicle crashes (5).
Research interest in the relationship of sleep and health has continued to grow since the NHIS first collected sleep data more than 30 years ago. The National Center for Sleep Disorders Research (NCSDR), established in 1993 at the National Institutes of Health (NIH), has been instrumental in promoting multidisciplinary research on this important public health issue (6-9). Evidence suggests that the number of hours of sleep needed for optimal functioning varies by individual genetic make-up, life stage, and other factors, although some studies have identified 7 to 8 hours of sleep as the optimal number for good health (10). Clinical research has identified physiological consequences of sleep restriction, including impairments in endocrine function and metabolic and inflammatory responses (10). Studies of the behavioral correlates of sleep in clinical and special populations have focused on the associations between sleep practices and other health-related behaviors, including smoking, alcohol use, exercise, and obesity (11-16).
This report uses data from the 2004-2006 NHIS Sample Adult questionnaires to explore the association between sleep duration and prevalence of selected health risk behaviors. The NHIS, a survey of the civilian noninstitutionalized population of the United States, has been an important source of information about health and health care since it was first conducted in 1957. NHIS is a multistage probability sample survey that is conducted continuously throughout the year by the Centers for Disease Control and Prevention's National Center for Health Statistics (NCHS). Interviews are conducted by staff of the U.S. Census Bureau under contract with NCHS. The NHIS questionnaire consists of three main components: the Family Core, the Sample Adult Core, and the Sample Child Core. The Family Core collects information for all family members regarding household composition, sociodemographic characteristics, and basic health indicators. The Sample Adult and Sample Child Cores obtain additional information on the health of one randomly selected adult and child in the family. The sample adult responds for himself or herself. For further information about NHIS, see the NHIS website.
Information on sleep duration in this report was obtained from the question "How many hours do you usually sleep in a 24-hour period?" Responses were provided in whole hours and classified for this analysis into four categories: Less than 6 hours, 6 hours, 7 to 8 hours, and 9 hours or more. Health behavior data were obtained from questions about cigarette smoking, alcohol use, leisure-time physical activity, and body weight status asked in the Adult Health Behaviors section of the questionnaire. Definitions for each of these health risk behaviors can be found in the table footnotes. Additional information about the NHIS measures of health risk behaviors in this report has been previously published (17).
All estimates and associated standard errors shown in this report were generated using SUDAAN, a software package that is designed to account for a complex sample design such as that of the NHIS (18). All estimates were weighted by using the sample adult record weight and therefore represent the U.S. civilian noninstitutionalized population aged 18 years and over. Estimates were calculated excluding unknowns (i.e., refused, not ascertained, or don't know) from the denominators. Item nonresponse ranged from 1% for the demographic characteristics to 5% for the alcohol and body weight questions.
Age-adjusted estimates were compared using two-tailed statistical tests at the 0.05 level of significance. No adjustments were made for multiple comparisons. Terms such as "greater than" and "less than" indicate a statistically significant difference. Terms such as "similar" or "no difference" indicate that the statistics being compared were not significantly different. Lack of comment regarding the difference between any two statistics does not mean that the difference was tested and found to be not significant.
References
- National Heart, Lung, and Blood Institute. Your guide to healthy sleep. National Institutes of Health. NIH Pub No. 06-5271. Department of Health and Human Services. November 2005.
- Schoenborn CA, Cohen BH. Trends in smoking, alcohol consumption, and other health practices among U.S. adults, 1977 and 1983. Advance data from vital and health Statistics no 118. Hyattsville, MD. National Center for Health Statistics. June 30, 1986.
- U.S. Department of Health and Human Services. Promoting health/ preventing disease: objectives for the Nation. Washington, D.C. Public Health Service. 1980.
- U.S. Department of Health and Human Services. Healthy People 2000: National health promotion and disease prevention objectives. Washington, D.C. U.S. Public Health Service. 1990.
- U.S. Department of Health and Human Services. Healthy People 2010. 2nd ed. With understanding and improving health and objectives for improving health. 2 vols. Washington, D.C., U.S. Government Printing Office. 2000. (Objectives 24-11a-b and 24-12.)
- National Center for Sleep Disorders Research. National Heart Lung and Blood Institute. National Institutes of Health. Internet. www.nhlbi.nih.gov/about/ncsdr . Accessed: April 2, 2008.
- National Center for Sleep Disorders Research. 2003 National sleep disorders research plan. National Heart, Lung, and Blood Institute. National Institutes of Health. NIH Publication No. 03-5209. July 2003.
- National Institutes of Health. National Sleep Conference. Frontiers of knowledge in sleep and sleep disorders: opportunities for improving health and quality of life. Summary Report. National Center for Sleep Disorders Research, National Heart, Lung, and Blood Institute. March 29-30, 2004.
- National Center on Sleep Disorders Research. Guide to selected publicly available sleep-related data resources. National Heart, Lung, and Blood Institute. National Institutes of Health. July 2006. Available from: http://www.nhlbi.nih.gov/about/ncsdr/research/sleep-datasets-july-06.pdf.
- Banks S, Dinges DF. Behavioral and physiological consequences of sleep restriction. J Clin Sleep Med 3(5):519-28. 2007.
- Zhang L, Samet J, Caffo B, Punjabi NM. Cigarette smoking and nocturnal sleep architecture. Am J Epidemiol 164:529-37. September 15, 2006.
- Phillips BA, Danner FJ. Cigarette smoking and sleep disturbance. Arch. Internal Med. 155(7):734-37. April 10, 1995.
- National Institute on Alcohol Abuse and Alcoholism. Alcohol and sleep. Alcohol alert. No 41. National Institutes of Health. Rockville, MD. July 1998.
- Driver HS, Taylor SR. Exercise and sleep. Sleep Medicine Reviews, Vol 4(4) pp 387-402. 2000.
- Hasler G, Buysse DJ, Klaghofer R, et al. The association between short sleep duration and obesity in young adults: a 13-year prospective study. Sleep 27 (4): 661-6. 2004.
- Patel SR, White DP, Gottlieb DJ, Hu FB. Association between reduced sleep and weight gain in women. Am J Epidemiol 164:947-54. 2006.
- Adams PF, Schoenborn CA. Health behaviors of adults: United States, 2002-04. National Center for Health Statistics. Vital Health Stat 10(230). 2006.
- Research Triangle Institute SUDAAN (Release 9.0.1). [Computer Software]. Research Triangle Park, NC: Research Triangle Institute. 2005.
Figures
Tables
|
Usual hours of sleep |
Currently
smoked cigarettes2 |
Had five or
more drinks in 1 day3 |
Physically
inactive in leisure time4 |
Obese5 |
|---|---|---|---|---|
Percent of adults6
(standard error) |
||||
Adults aged 18 years and
over7 |
20.8 (0.19) |
19.7 (0.22) |
39.8 (0.35) |
24.7 (0.19) |
Less than 6 hours |
30.5 (0.69) |
22.0 (0.67) |
44.3 (0.75) |
33.3 (0.67) |
6 hours |
22.8 (0.38) |
21.6 (0.39) |
38.6 (0.51) |
28.4 (0.43) |
7 to 8 hours |
18.3 (0.22) |
19.2 (0.26) |
37.9 (0.41) |
22.2 (0.23) |
9 hours or more |
26.2 (0.70) |
18.5 (0.63) |
48.2 (0.81) |
26.3 (0.69) |
See footnotes at end of Table 4.
|
Sex and usual hours of sleep |
Currently
smoked cigarettes2 |
Had five or
more drinks in 1 day3 |
Physically
inactive in leisure time4 |
Obese5 |
|---|---|---|---|---|
Percent of adults6
(standard error) |
||||
All men7 |
23.4 (0.28) |
27.7 (0.34) |
38.5 (0.42) |
24.8 (0.28) |
| Less than 6 hours |
32.8 (1.08) |
31.3 (1.09) |
40.6 (1.10) |
32.7 (1.05) |
| 6 hours |
25.5 (0.58) |
30.6 (0.61) |
37.0 (0.69) |
28.2 (0.62) |
| 7 to 8 hours |
20.6 (0.32) |
26.8 (0.39) |
37.1 (0.50) |
22.7 (0.34) |
| 9 hours or more |
31.9 (1.19) |
26.3 (1.12) |
46.6 (1.21) |
25.2 (1.03) |
All women7 |
18.4 (0.23) |
12.1 (0.21) |
41.0 (0.39) |
24.5 (0.26) |
| Less than 6 hours |
28.5 (0.84) |
13.3 (0.70) |
47.9 (0.97) |
34.0 (0.90) |
| 6 hours |
20.2 (0.50) |
12.4 (0.43) |
40.0 (0.65) |
28.5 (0.59) |
| 7 to 8 hours |
16.1 (0.27) |
11.9 (0.26) |
38.5 (0.47) |
21.6 (0.30) |
| 9 hours or more |
21.9 (0.82) |
12.8 (0.69) |
49.2 (1.04) |
27.2 (0.91) |
See footnotes at end of Table 4.
|
Age8 and usual hours of sleep |
Currently
smoked cigarettes2 |
Had five or
more drinks in 1 day3 |
Physically
inactive in leisure time4 |
Obese5 |
|---|---|---|---|---|
Percent of adults6
(standard error) |
||||
18-44 years
of age7 |
23.8 (0.28) |
27.4 (0.35) |
35.4 (0.43) |
22.5 (0.27) |
| Less than 6 hours |
37.6 (1.07) |
32.5 (1.15) |
36.1 (1.06) |
32.8 (0.99) |
| 6 hours |
27.0 (0.58) |
29.9 (0.63) |
33.2 (0.69) |
26.6 (0.60) |
| 7 to 8 hours |
20.5 (0.32) |
26.4 (0.41) |
34.8 (0.49) |
19.8 (0.31) |
| 9 hours or more |
30.1 (1.04) |
26.2 (1.06) |
41.1 (1.19) |
23.2 (0.98) |
45-64 years
of age7 |
22.0 (0.31) |
15.0 (0.27) |
40.1 (0.46) |
29.7 (0.35) |
| Less than 6 hours |
29.6 (1.10) |
14.2 (0.87) |
48.3 (1.21) |
37.9 (1.22) |
6 hours |
22.5 (0.67) |
16.4 (0.58) |
39.1 (0.80) |
33.2 (0.75) |
| 7 to 8 hours |
20.0 (0.38) |
15.1 (0.35) |
37.3 (0.56) |
26.9 (0.43) |
| 9 hours or more |
28.6 (1.28) |
13.3 (0.94) |
52.6 (1.47) |
34.1 (1.37) |
|
65 years of age and older7 |
9.2 (0.26) |
3.9 (0.19) |
53.3 (0.55) |
22.5 (0.39) |
| Less than 6 hours |
10.4 (1.01) |
3.5 (0.58) |
62.9 (1.65) |
26.8 (1.50) |
| 6 hours |
10.3 (0.68) |
4.6 (0.48) |
54.4 (1.13) |
25.7 (0.99) |
| 7 to 8 hours |
8.6 (0.34) |
3.9 (0.25) |
48.4 (0.69) |
21.1 (0.48) |
| 9 hours or more |
9.9 (0.68) |
3.8 (0.48) |
62.8 (1.16) |
22.3 (1.03) |
See footnotes at end of Table 4.
|
Race/ethnicity9 and usual hours of
sleep |
Currently smoked cigarettes2 |
Had five or
more drinks in 1 day3 |
Physically
inactive in leisure time4 |
Obese5 |
|---|---|---|---|---|
Percent of adults6
(standard error) |
||||
Non-Hispanic
white7 |
22.6 (0.25) |
22.7 (0.29) |
35.4 (0.41) |
23.6 (0.23) |
|
Less than 6 hours |
34.2 (0.90) |
25.5 (0.91) |
42.4 (0.94) |
31.7 (0.84) |
|
6 hours |
25.4 (0.49) |
24.9 (0.52) |
35.0 (0.62) |
27.5 (0.52) |
| 7 to 8 hours |
19.7 (0.28) |
22.0 (0.32) |
32.9 (0.48) |
21.2 (0.27) |
9 hours or more |
28.1 (0.93) |
21.3 (0.87) |
44.7 (1.02) |
24.8 (0.90) |
Non-Hispanic
black7 |
21.0 (0.50) |
11.2 (0.40) |
51.1 (0.72) |
34.0 (0.58) |
Less than 6 hours |
25.4 (1.35) |
12.0 (1.05) |
48.8 (1.69) |
43.1 (1.59) |
6 hours |
19.6 (0.91) |
12.0 (0.76) |
45.8 (1.22) |
36.1 (1.13) |
| 7 to 8 hours |
19.3 (0.63) |
10.5 (0.55) |
51.8 (0.91) |
31.4 (0.72) |
| 9 hours or more |
29.3 (1.72) |
13.9 (1.30) |
58.0 (1.84) |
33.1 (1.73) |
Non-Hispanic
Asian7 |
11.1 (0.67) |
8.5 (0.58) |
39.7 (1.14) |
7.4 (0.57) |
| Less than 6 hours |
15.6 (3.02) |
12.4 (2.55) |
39.0 (3.77) |
10.6 (2.28) |
| 6 hours |
9.7 (1.20) |
11.3 (1.51) |
40.9 (2.31) |
7.6 (1.21) |
| 7 to 8 hours |
10.8 (0.85) |
7.5 (0.67) |
37.7 (1.35) |
7.2 (0.71) |
| 9 hours or more |
14.5 (3.55) |
8.0 (2.21) |
44.9 (4.80) |
*9.6 (3.23) |
Hispanic7 |
14.7 (0.38) |
16.7 (0.41) |
54.1 (0.63) |
27.4 (0.49) |
| Less than 6 hours |
19.3 (1.55) |
19.3 (1.42) |
53.5 (1.81) |
34.9 (1.90) |
| 6 hours |
16.4 (0.86) |
18.4 (0.93) |
52.5 (1.32) |
33.3 (1.15) |
| 7 to 8 hours |
13.4 (0.44) |
16.3 (0.51) |
53.5 (0.77) |
25.0 (0.60) |
| 9 hours or more |
18.7 (1.39) |
16.8 (1.35) |
53.9 (1.76) |
26.9 (1.56) |
*Estimates preceded by an asterisk have a relative standard error of greater than 30% and less than or equal to 50% and should be used with caution as they do not meet the standard of reliability or precision.
1Based on the question "On average, how many hours of sleep do you get in a 24-hour period?" Response options were 1 to 24 hours.
2Smoked at least 100 cigarettes in lifetime and currently smoked every day or some days.
3The percentage of adults who had five or more drinks in 1 day at least once in the past year is shown as the percentage of all adults with the specified hours of sleep. Adults who did not drink in the past year were not asked the question but were included in the denominator (classified as "no") for this analysis.
4Never engaged in any light to moderate or vigorous leisure-time physical activity.
5Obese is defined as a body mass index (BMI) greater than or equal to 30. BMI=weight (in kilograms)/[height (in meters)]2.
6Denominator for each percentage excludes persons with unknown health risk behavior characteristic.
7Includes adults with unknown hours of sleep.
8Estimates for age groups are not age adjusted.
9The categories for race include only persons who indicated a single-race group. Other race/ethnicity groups are not shown due to statistical unreliability of estimates when these groups were classified by hours of sleep. Persons of Hispanic or Latino origin may be of any race or combination of races.
NOTES: Unless otherwise specified, estimates are age adjusted using the projected 2000 U.S. population as the standard population and using three age groups: 18-44 years, 45-64 years, and 65 years and over. Estimates are based on household interviews of a sample of the civilian, noninstitutionalized population.
DATA SOURCE: CDC\NCHS, National Health Interview Survey, 2004-2006.
Page Last Modified: July 31, 2008
National Center for Health
Statistics
3311 Toledo Road
Hyattsville, MD 20782
Phone:
1-800-232-4636
cdcinfo@cdc.gov
Centers for Disease Control and Prevention, 1600 Clifton Rd, Atlanta, GA 30333, U.S.A
Tel: (404) 639-3311 / Public Inquiries: (404) 639-3534 / (800) 311-3435