 |
|
|
|
|
|
|
|
|
|
|
|
|
|
|
|
|
||||
| ||||||||||
|
|
|
|
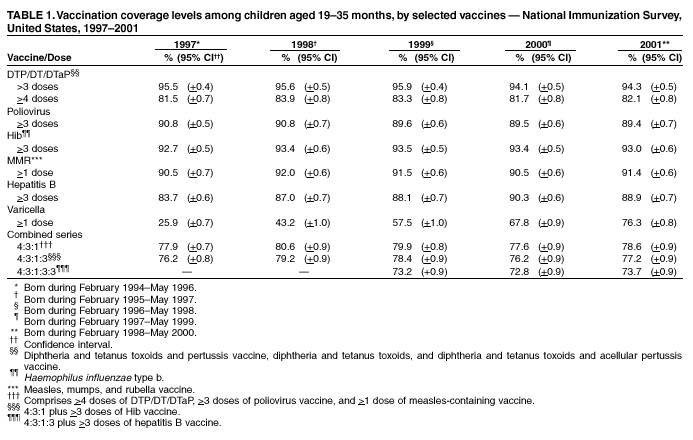
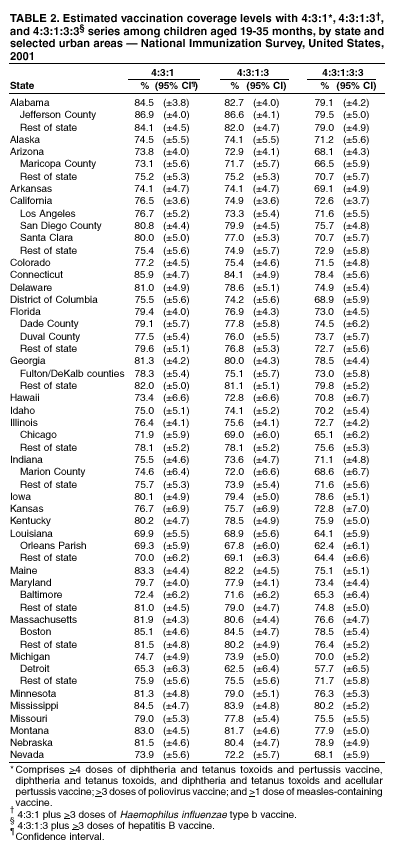
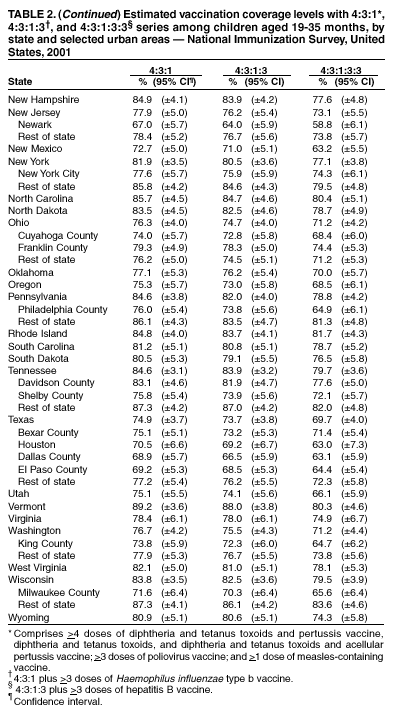
National, State, and Urban Area Vaccination Coverage Levels Among Children Aged 19--35 Months --- United States, 2001Each annual birth cohort in the United States comprises approximately four million infants. Maintaining the gains in childhood vaccination coverage attained during the 1990s among these children poses an ongoing challenge for public health. The National Immunization Survey (NIS) is an ongoing survey that provides estimates of vaccination coverage among children aged 19--35 months on the basis of data for the most recent 12 months for each of the 50 states and 28 selected urban areas. This report presents NIS findings for 2001*, which indicate a substantial nationwide increase in coverage with >1 dose of varicella vaccine (VAR), generally steady coverage for other vaccines nationwide, and wide variability in coverage among the states and urban areas covered by NIS. To collect vaccination data for all age-eligible children, NIS uses a quarterly random-digit--dialing sample of telephone numbers for each survey area. NIS methodology, including how the responses are weighted to represent the population of children aged 19--35 months, has been described previously (1,2). During 2001, household interviews were completed for 33,437 children; of these, adequate health-care provider information was available for 23,551. The response rate for eligible households for the 78 survey areas was 63.8%. For this report, NIS data for 2001 were compared with data for 2000† (3). National vaccination coverage with >1 dose of VAR increased from 67.8% (95% confidence interval [CI]=+0.9%) in 2000 to 76.3% (95% CI=+0.8%) in 2001. Coverage with >1 dose of measles, mumps, and rubella (MMR) vaccine increased from 90.5% (95% CI=+0.6%) in 2000 to 91.4% (95% CI=+0.6%) in 2001, and coverage with >3 doses of hepatitis B vaccine (HepB) decreased from 90.3% (95% CI=+0.6%) in 2000 to 88.9% (95% CI=+0.7%) in 2001 (Table 1). In 2001, estimated vaccination coverage differed substantially among states. The estimated coverage with the 4:3:1:3:3 series§ ranged from 81.7% in Rhode Island to 63.2% in New Mexico, a difference of 18.5 percentage points (Table 2). Variability among states was lowest for 3 doses of diphtheria and tetanus toxoids and pertussis vaccine, diphtheria and tetanus toxoids, and diphtheria and tetanus toxoids and acellular pertussis vaccine (DTP/DT/DTaP) (9.1 percentage points; range: 89.2%--98.3%) and highest for 1 dose of VAR (34.1 percentage points; range: 55.8%--89.9%). Variability among the 28 urban areas was slightly greater than among states. Among the 28 urban areas, the highest estimate for coverage with the 4:3:1:3:3 series was 79.5% in Jefferson County, Alabama, and the lowest was 57.7% in Detroit, Michigan, a difference of 21.8 percentage points. For the 4:3:1:3:3 series, the magnitude of the disparity between the highest and lowest estimates for states has been consistent during the preceding 4 years (20.3 percentage points in 1998, 21.4 in 1999, 19.3 in 2000, and 18.5 in 2001) having decreased from 28.1 percentage points in 1997. The decreased disparity in 1998 compared with 1997 was attributed mostly to more complete implementation of hepatitis B vaccination in a few states. No state consistently had either the highest or lowest coverage estimates from year to year. Reported by: L Barker, PhD, E Luman, MS, Z Zhao, PhD, P Smith, PhD, R Linkins, PhD, Data Management Div; J Santoli, MD, L Rodewald, MD, Immunization Svcs Div; M McCauley, MTSC, Office of the Director, National Immunization Program, CDC. Editorial Note:The findings in this report indicate that among U.S. children aged 19--35 months, coverage with recommended vaccines remains near all-time highs, and declines observed recently probably are too limited to pose a major public health risk. Although coverage with recommended vaccines for each new birth cohort remains high, vigilance is needed to maintain these high levels. Eliminating the disparity between states and urban areas with the highest and lowest coverage remains a priority. Should vaccine-preventable disease be introduced in an area with low coverage, groups of susceptible persons might serve as a reservoir to transmit disease. The findings in this report are subject to at least three limitations. First, NIS is a telephone survey; although statistical weights adjust for nonresponses and households without telephones, some bias might remain. Second, NIS relies on provider-verified vaccination histories; incomplete records and reporting could result in underestimates of coverage. The estimation procedure assumes that coverage among children whose providers do not respond is similar to that among children whose providers respond. Finally, although national level estimates are precise, estimates for states and urban areas should be interpreted with caution (4). In October 2000, the Advisory Committee on Immunization Practices recommended that all children aged 2--24 months without contraindications receive 4 doses of pneumococcal vaccine (5). The first NIS coverage estimates will be presented next year because the recommendation applies to all children covered by the 2002 NIS. Shortages of routinely recommended childhood vaccines, including DTaP, pneumococcal conjugate vaccine (PCV7), MMR, varicella vaccine, and tetanus toxoid began in early 2001 (6--9). The shortages did not affect coverage in 2001 because almost all children included in the 2001 NIS were eligible to receive recommended vaccines before 2001. As children potentially affected by the shortages are surveyed by NIS, CDC will monitor the impact on coverage. The supplies of all vaccines, except PCV7, have improved. Additional information about the status of the vaccine shortages is available at http://www.cdc.gov/nip/news/shortages/default.htm. References
* For the January--December 2001 reporting period, NIS included children born during February 1998--May 2000. † For the January--December 2001 reporting period, NIS included children born during February 1997--May 1999. § Comprises >4 doses of diphtheria and tetanus toxoids and pertussis vaccine, diphtheria and tetanus toxoids, and diphtheria and tetanus toxoids and acellular pertussis vaccine; >3 doses of poliovirus vaccine; >1 dose of measles-containing vaccine; >3 doses of Haemophilus influenzae type b vaccine; and >3 doses of HepB vaccine.
|
Use of trade names and commercial sources is for identification only and does not imply endorsement by the U.S. Department of
Health and Human Services. |
Disclaimer All MMWR HTML versions of articles are electronic conversions from ASCII text into HTML. This conversion may have resulted in character translation or format errors in the HTML version. Users should not rely on this HTML document, but are referred to the electronic PDF version and/or the original MMWR paper copy for the official text, figures, and tables. An original paper copy of this issue can be obtained from the Superintendent of Documents, U.S. Government Printing Office (GPO), Washington, DC 20402-9371; telephone: (202) 512-1800. Contact GPO for current prices.
**Questions or messages regarding errors in formatting should be addressed to mmwrq@cdc.gov.Page converted: 8/1/2002
|
|
|||||
|
HOME |
ABOUT MMWR |
MMWR SEARCH |
DOWNLOADS |
RSS
|
CONTACT
|
|||||
|
|
|||||
|
This page last reviewed 8/1/2002