|
 Global Analysis / Global Hazards / United States / U.S.
Drought / Extremes
Global Analysis / Global Hazards / United States / U.S.
Drought / Extremes
Use these links to
access detailed analyses of Global and U.S. data.

 Drought & Heat | Flooding | Storms | Tropical Cyclones | Extratropical Cyclones | Severe Winter Weather

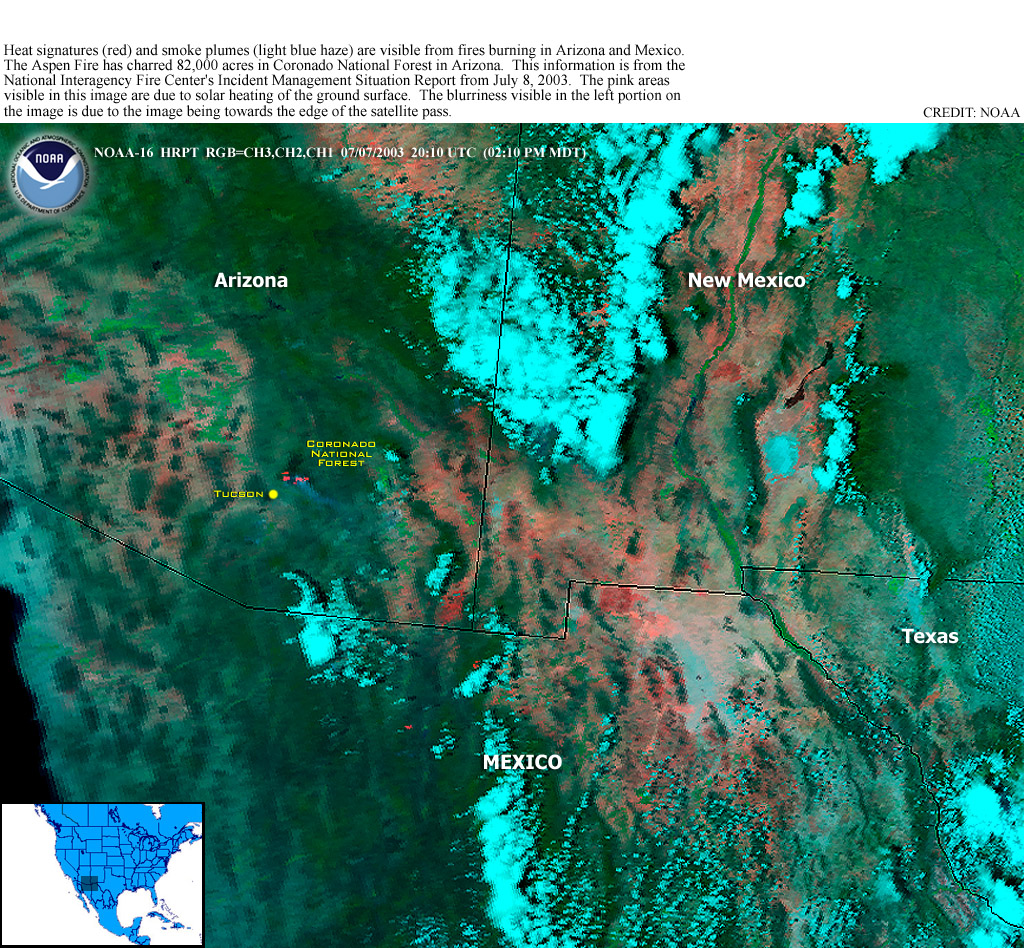
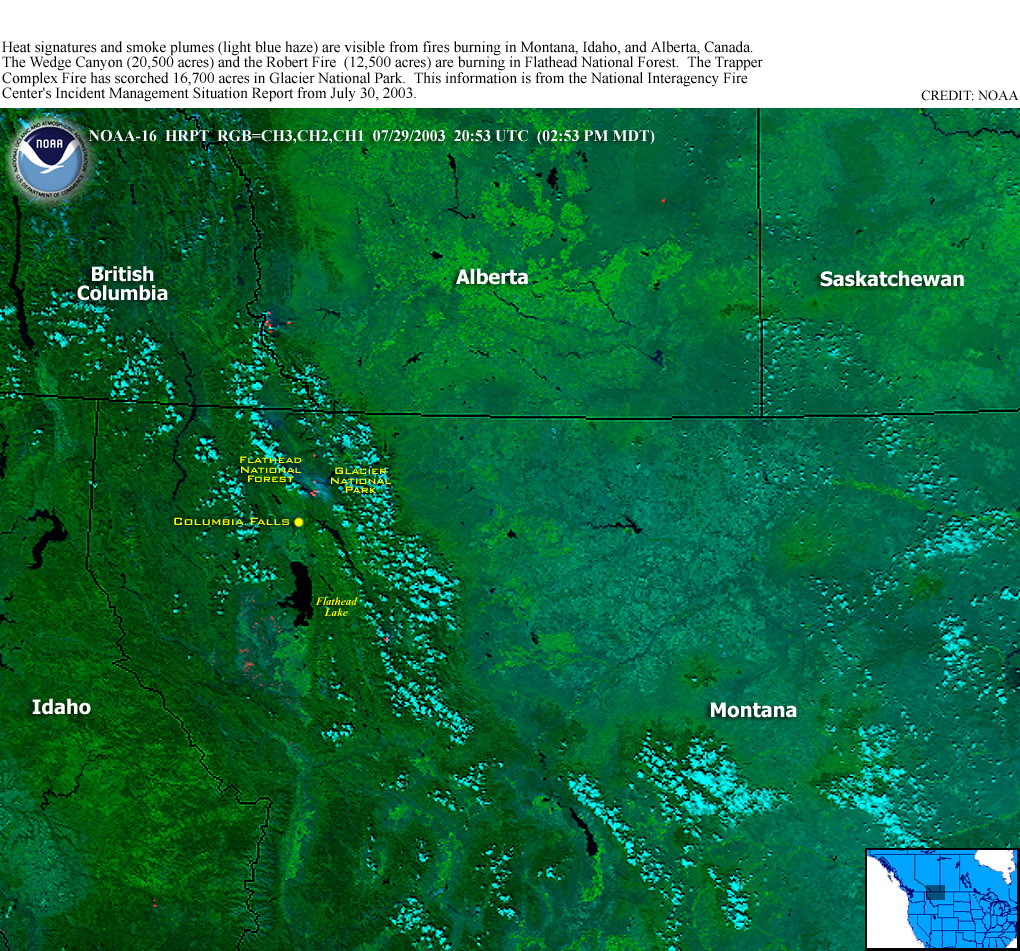
| Long-term drought conditions in the western U.S. continued during July, with dry weather exacerbating wildfire conditions throughout the region. In Montana, two large fires affected the Flathead National Forest and Glacier National Park. Nationally, the number of acres burned through the end of July was far less than at the same time in 2002. |
larger image
|
For comprehensive coverage on U.S. drought conditions, see the U.S. drought pages.
 larger image larger image
|
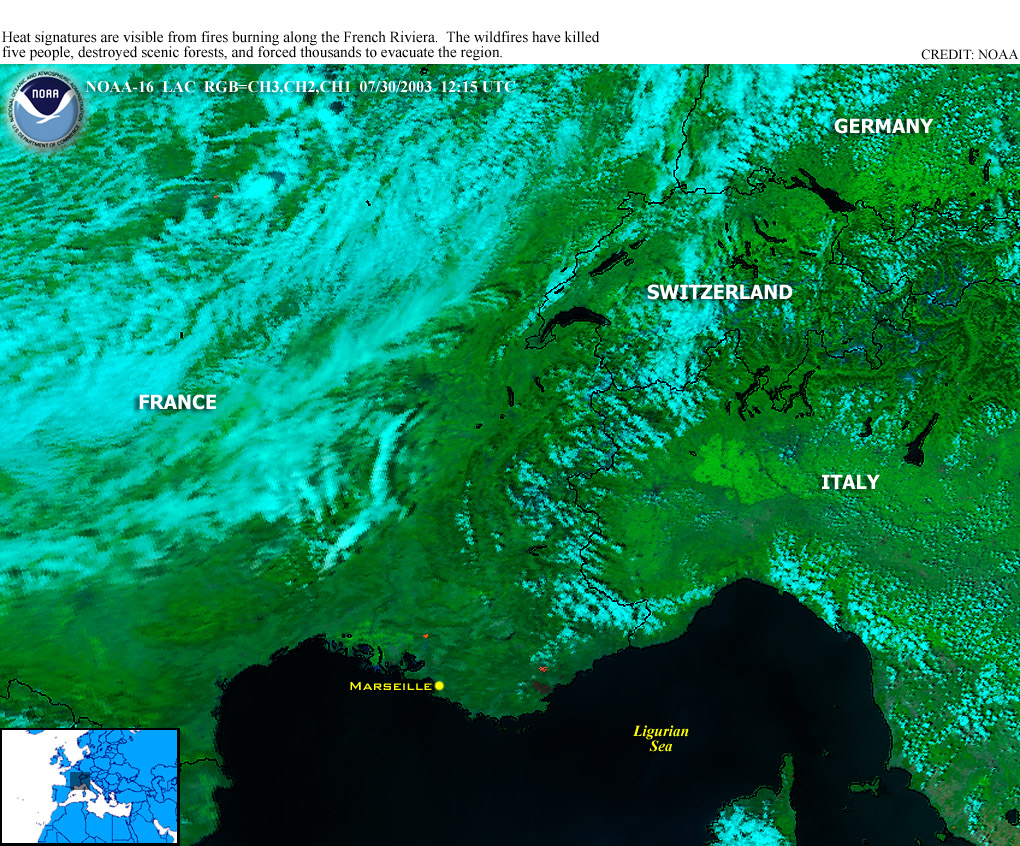
A heat wave affected much of Europe during July, with daily temperatures between 30-37°C (90-99°F) across many areas from France and Switzerland southeastward across the Mediterranean region. In Switzerland, boulders in a rock face on the Matterhorn were released by the accelerated melting of ice at a height of 3,400 meters (11,220 feet), causing a huge rockfall that required the rescue of 40 climbers and the closing of the entire mountain to climbers for five days (WMO/MeteoSuisse). Across Italy, temperatures reached 36°C (96°F) on the 15th, where hot, dry weather intensified drought conditions. The hottest weather had shifted east across southern and eastern Europe by the 17th.
|
| Above average temperatures and dry weather worsened drought conditions throughout much of southern and central Europe, from France eastward through Romania and Croatia. Wildfires broke out from Portugal to eastern Russia, with 5 fatalities attributed to fires that burned in parts southern France (BBC News). |
 larger image
|
Croatia's major rivers, including the Sava, Drava, Kupa and Danube, were reported at their lowest levels ever. In neighboring Serbia, the ecology minister reported that the country's rivers were at their lowest levels in 100 years (Associated Press).
 larger image larger image
|
In Afghanistan, major sandstorms affected more than 12,000 people and were described as the "worst sandstorms in living memory" (AFP). Sandstorms began in the region during early June and continued during July. Up to 20 villages had to be evacuated because they were completely covered in sand, and many irrigation canals and waterways had also been filled.
|
| In contrast to the heat wave that affected much of Europe in July 2003, temperatures across Oman were much below normal. A series of rare easterly disturbances that traversed westward from Pakistan and India and across the Arabian Sea brought scattered rain and thundershowers to the country. There was a significant reduction in air temperature over almost all of Oman, due to the clouds, rainfall and a cold current which moved into the Gulf of Oman (DGCAM). |
 larger image
|


| Seasonal monsoon rains brought flooding to areas of South Asia, including parts of India, Bangladesh, Nepal and Pakistan, with more than 200 fatalities (Reuters). Some hardest-hit areas included much of Bangladesh and the states of Assam and West Bengal in northeastern India. On the 16th, flooding in the Shilagarh village in Himachal Pradesh, located about 400 km (250 miles) north of Delhi, killed at least 19 people at a construction site (BBC News). In China, heavy rains that began in late June continued into early July, bringing floods to Guizhou, Hunan, Sichuan and Guangxi provinces in the south central part of the country. Flooding in China has been blamed for more than 300 deaths since it began in late June (AFP). |
larger image
|
Flash floods in Mongolia struck the capital city of Ulaanbaatar and surrounding provinces during July 18-25, killing 15 people (OCHA).
Across Africa, flooding in eastern Uganda around July 7 produced landslides and brought the Manafa River above the flood stage. There were 20 deaths reported in Bubulo county, along with loss of livestock and crops (Disasterrelief.org). A rain-induced landslide in southern Cameroon on the 20th killed at least 20 people (OCHA).
 larger image larger image
|
The remnants of Tropical Storm Bill brought heavy rains to the southeast United States, where over 200mm (8 inches) fell locally along the Gulf Coast and up to 100 mm (4 inches) in parts of the southern Appalachians.
|
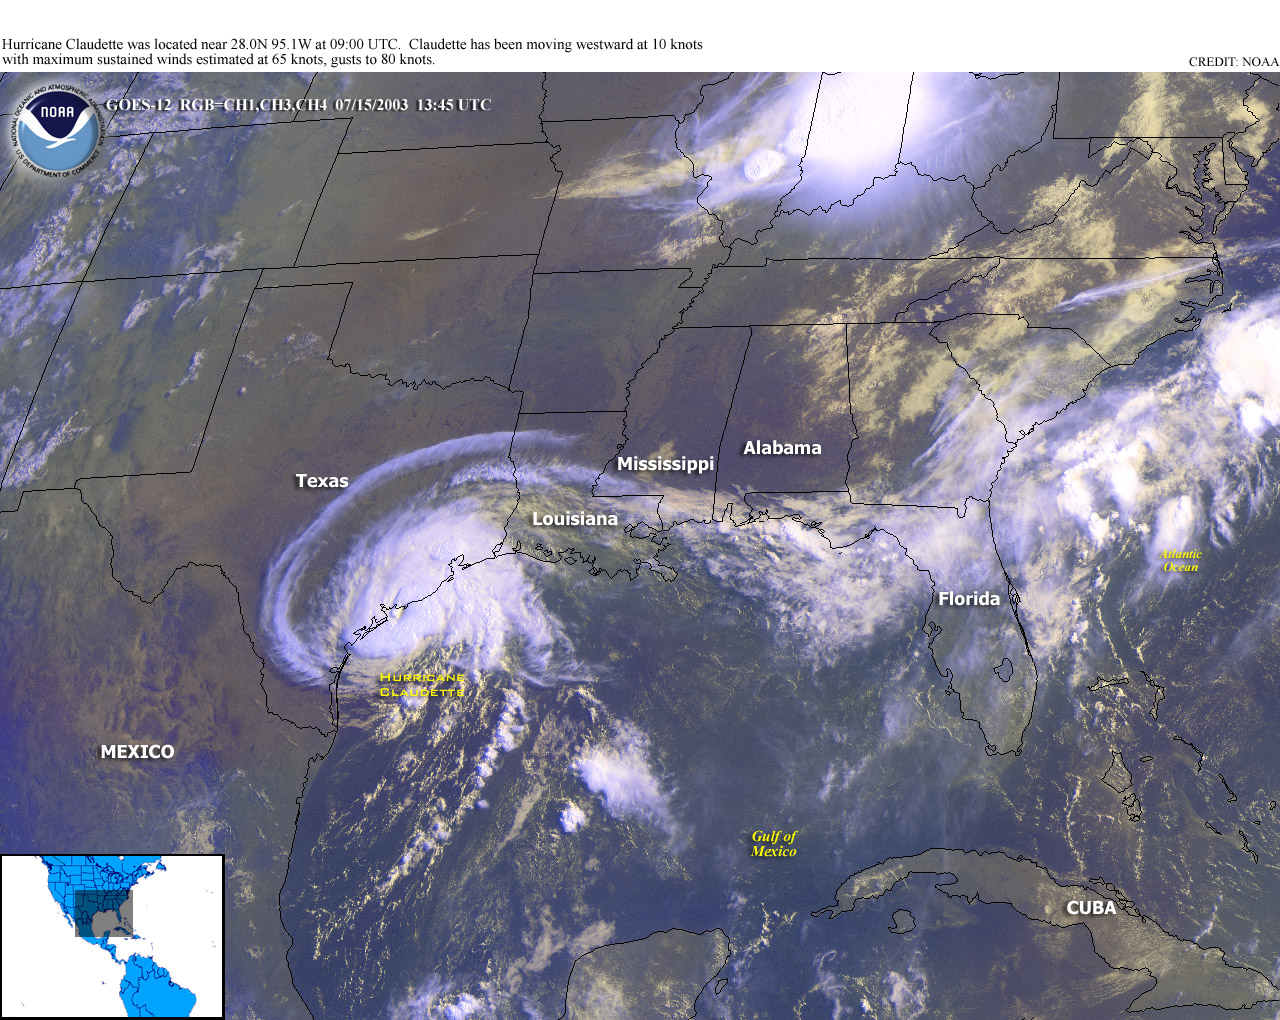
| Hurricane Claudette's weakened remains traversed westward into Texas during the 15th-16th producing locally heavy rains. Moisture from the storm's remnants brought rainfall to parched areas of south Texas, adjacent areas of northern Mexico and into the U.S. Desert Southwest by the 17th. |
larger image
|
 larger image larger image
|
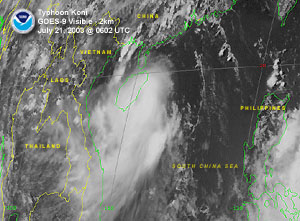
A pair of typhoons in the western Pacific (Koni and Imbudo) brought locally heavy, flooding rains to parts of the Philippines, southeastern coastal China and Vietnam during July 15-24.
|
For an archive of flood events worldwide, see the Dartmouth Flood Observatory.

 larger image larger image
|
Clusters of severe thunderstorms affected parts of the United States, primarily from the High Plains eastward through the Ohio Valley, during July 2-9. Numerous reports of wind damage and hail were received during this period.
|
| Severe thunderstorms associated with a frontal system affected areas of western and southwestern France on the 15th. Damaging winds, large hail and lightning were blamed for 4 fatalities and 70 injuries (AFP/BBC News). Some of the worst damage was in the southwestern city of Bordeaux, where winds reached as high as 150 km/hr (94 mph), damaging roofs and knocking down many trees. |

Larger Image
Animation Also Available (~2.2 MB)
|
 Click for Animation Click for Animation
|
In the United States, severe thunderstorms brought strong winds to the Memphis, TN area early on the 22nd, and caused widespread power outages and 4 deaths (Associated Press). Winds in the metropolitan area gusted as high as 100 mph as the storms moved through (Associated Press). By early August, more than 15,000 people remained without power in the Memphis area from the late-July thunderstorms (Associated Press).
|

| Hurricane Claudette developed in the Caribbean Sea on the 9th and moved across the northern tip of Mexico's Yucatan Peninsula on the 11th with maximum sustained winds near 90 km/hr (50 knots or 55 mph). |
larger image
|
 Click for Animation Click for Animation
|
Claudette then tracked northwestward into the Gulf of Mexico, attaining category-1 hurricane status. Claudette made landfall along the Texas Gulf Coast near Port O'Connor on the 15th with maximum sustained winds near 120 km/hr (65 knots or 75 mph). The storm caused considerable damage, left tens of thousands without power, and was responsible for two deaths (AFP). Heavy rainfall and localized flooding occurred well inland.
|
| Typhoon Koni developed in the western Pacific Ocean on the 15th and tracked through the southern and central Philippines on the 17th as a tropical storm. Koni attained typhoon status on the 20th as it moved through the South China Sea. Koni struck the island of Hainan on the 21st at minimal typhoon strength with maximum sustained winds of 120 km/hr (65 knots or 75 mph). Th storm then crossed the Gulf of Tonkin and into northern Vietnam on the 22nd. |
larger image
|
 larger image larger image
|
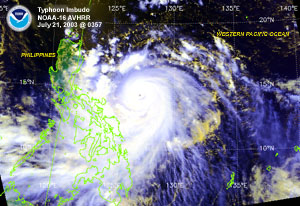
Typhoon Imbudo developed in the western Pacific Ocean on the 16th and reached typhoon strength by the 18th. Imbudo made landfall across Luzon in the northern Philippines on the 22nd with maximum sustained winds near 240 km/hr (130 knots or 150 mph). The typhoon was the strongest to hit the Philippines in 5 years, causing 10 deaths, and producing at least $18.5 million (USD) in damage to crops (Reuters).
|
Imbudo then tracked westward through the South China Sea and came ashore in southern China near Yangjiang (about 190 miles southwest of Hong Kong) on the 24th. Maximum sustained winds were near 165 km/hr (90 knots or 105 mph) and it was one of the strongest typhoons to impact the region in several years, causing 20 deaths (Reuters). The Hong Kong Observatory reported that it was the strongest typhoon to hit Guangdong province since Typhoon Sally devastated the region in 1996. Typhoon Sally caused 123 deaths and 4,300 injuries (Reuters).


| Cold and snowy weather characterized conditions across much of New Zealand during the first week of July, where locally 30 cm (12 inches) of snow fell in parts of the country. The snowstorm was described by local media as the worst in 50 years, causing thousands of power outages to homes and businesses and stranding hundreds of motorists (New Zealand Herald). |
larger image
|
In Peru, a series of strong cold fronts ushered in cold air and strong winds that affected the highlands of the southern departments of Arequipa, Puno, Moquegua, Tacna and Cuzco with temperatures falling as low as -20°C (-4°F). At least 25 deaths were attributed to the cold, with hundreds of livestock killed (IFRC).
References:
Basist, A., N.C. Grody, T.C. Peterson and C.N. Williams, 1998: Using the Special Sensor Microwave/Imager to Monitor Land Surface Temperatures, Wetness, and Snow Cover. Journal of Applied Meteorology, 37, 888-911.
Peterson, Thomas C. and Russell S. Vose, 1997: An overview of the Global Historical Climatology Network temperature data base. Bulletin of the American Meteorological Society, 78, 2837-2849.
For all climate questions other than questions concerning this report, please contact the National Climatic Data Center's Climate Services Division:
Climate Services Division
NOAA/National Climatic Data Center
151 Patton Avenue, Room 120
Asheville, NC 28801-5001
fax: 828-271-4876
phone: 828-271-4800
email: ncdc.orders@noaa.gov
For more information, refer also to ...
Selected U.S. City and State Extremes
2003 Atlantic Hurricanes
2003 East Pacific Hurricanes
2003 U.S. Wildfire Summary
SSMI Derived Products
Global Historical Climatology Network (GHCN)
The Blended GHCN - SSM/I Product
The Global Temperature Anomalies
CLIMVIS - Global Summary of the Day
CAMS data provided by the Climate Prediction Center
Tropical Rainfall Measuring Mission (TRMM) - NASA
Geographic Reference Maps (pdf format)
For further information on the historical climate perspective presented in this report, contact:
Scott Stephens
NOAA/National Climatic Data Center
151 Patton Avenue
Asheville, NC 28801-5001
fax: 828-271-4328
email: Scott.Stephens@noaa.gov
-or-
Jay Lawrimore
NOAA/National Climatic Data Center
151 Patton Avenue
Asheville, NC 28801-5001
fax: 828-271-4328
email: Jay.Lawrimore@noaa.gov
 NCDC / Climate
Monitoring / Climate
of 2003 / Hazards / Search / Help NCDC / Climate
Monitoring / Climate
of 2003 / Hazards / Search / Help
http://www.ncdc.noaa.gov/oa/climate/research/2003/jul/hazards.html
Downloaded Tuesday, 16-Sep-2008 11:04:40 EDT
Last Updated Friday, 18-Nov-2005 14:12:00 EST by Scott.Stephens@noaa.gov
Please see the NCDC Contact Page if you have questions or comments.
|


